
By
staff writer
April 17th, 2024
There is the possibility of a trend reversal in case there is a break out of the price at $0.18 supply zone, traders should wait for the breakout at the upper supply zone or break down at lower demand zone to occur before taking a position.
Key Highlights
- There is a probability of the trend reversal;
- consolidation pattern confirmed;
- traders should wait for the break out at the upper supply zone or demand zone.
ADAUSD Price Long-term Trend: Bearish
Supply Zones:$0.10, $0.11, $0.13
Demand Zones: $0.08, $0.07, $0.06
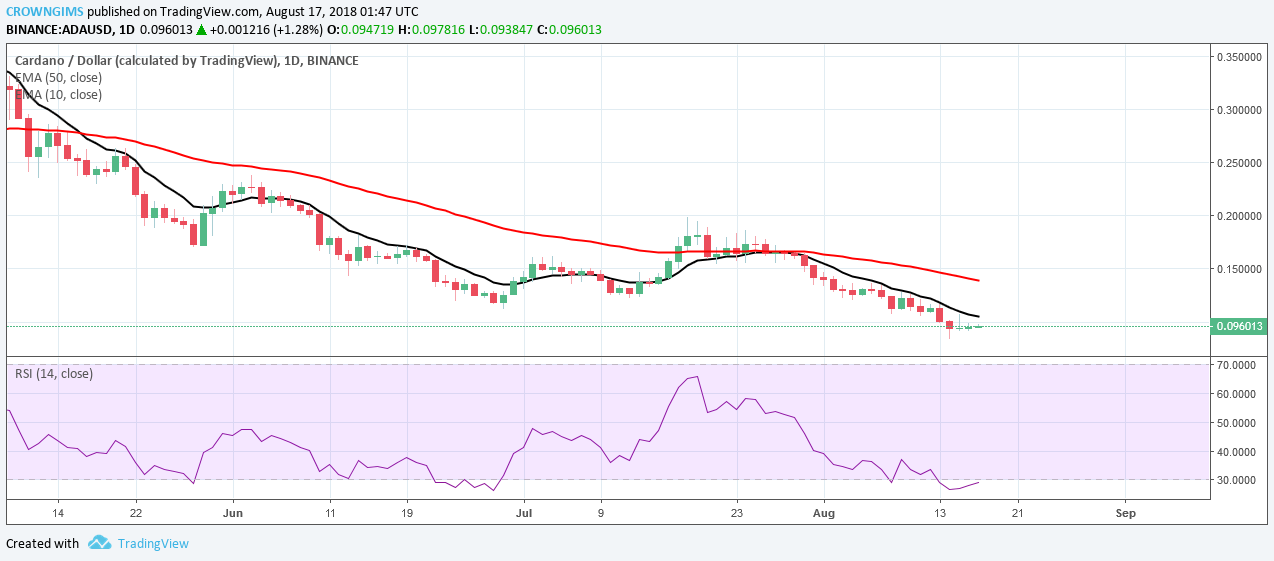
Cardano was bearish throughout last week in its long-term outlook. This downward movement was due to the breakout of the pair from the consolidation at $0.16 supply zone. The bearish pressure brought the cryptocurrency down to the demand zone at $0.08, which retraced to $0.09. The EMA 50-day remains above the 10-day EMA and ADAUSD remains below the 10-day EMA. Presently, to take Long trades are not illogical.
On the daily chart, there is a formation of more bullish candles which indicate the possibility of the trend reversal in case there is a break out of the price at $0.13 supply zone. This will require strong buying pressure from the buyer. RSI is below the 20-level (that is the oversold level). There are possibilities for upward movement next week.
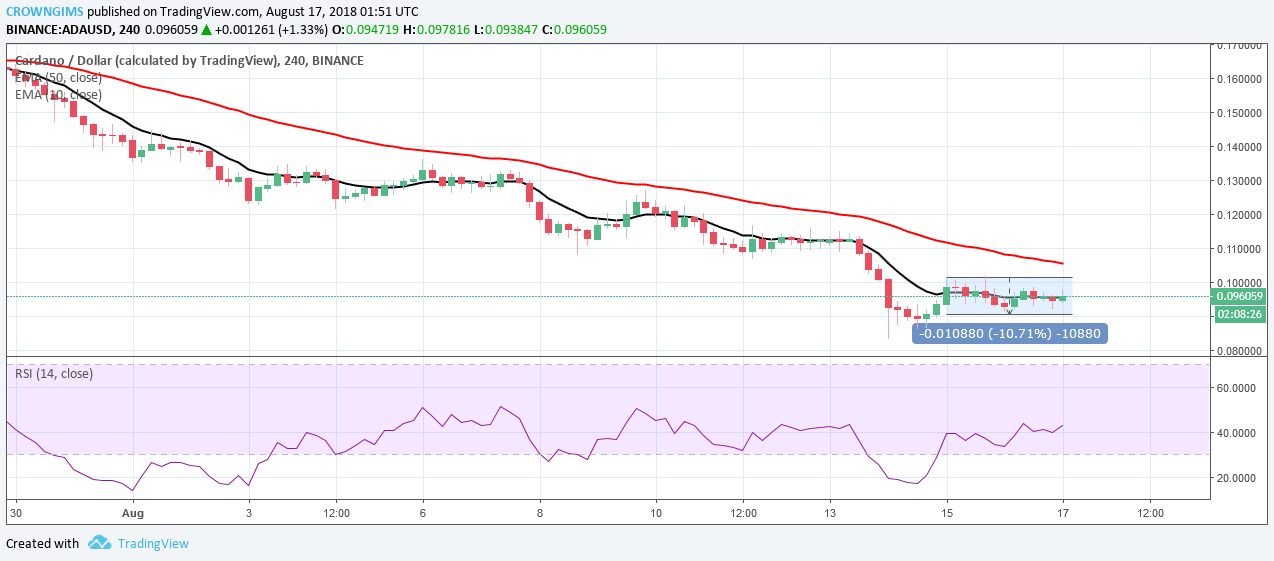
ADAUSD Medium-term Trend: Bearish
The pair has been bearish for some weeks, it has touched $0.08 demand zone before the bullish pressure brought the cryptocurrency to the level of $0.1. The price broke the demand zone of $0.1 to the downside, which led to further downward trending to the demand zone of $0.08. Cuurently, ADA returns to the range in its medium-term outlook. It is ranging and trading between $0.1 and $0.09 levels. Traders should wait for the breakout at the upper supply zone or break down at lower demand zone to occur before taking a position.
There is a tendency that the price will bounce from the demand zone of $0.08 and move upward, as more bullish candles are formed. The RSI 14 period is above the level 20, which is an oversold level. It indicates that the strength of the pair may increase. Uptrend movement could be triggered in case the supply zone of $0.1 is broken.