
By
Bhushan Akolkar
February 6th, 2024
Monero has formed the “Ascending Triangle” pattern, which connotes an upward breakout. Should the strong distribution level of $110 get broken, the pair will experience upward movement and get exposed to another strong distribution level at $120.
Key Highlights:
- There is confirmation of an Ascending Triangle Pattern in the Monero daily and 4-H chart;
- there is a probability of a breakout at $110 this week;
- traders are advised to speculate only on what they see.
XMR/USD Long-term Trend: Bearish
Distribution Territories: $110, $120, $130
Accumulation Territories: $70, $60, $50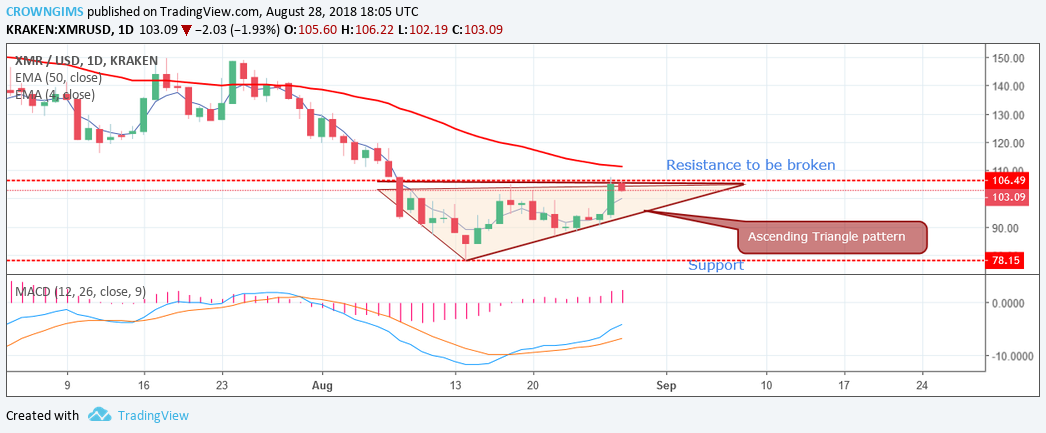 The coin was unable to break the distribution level of $110. The price bounced downward with the formation of a strong bearish candle. It made the price to continue it’s downwards trending within the territories of $110 and $70. The 4-day EMA crossed the 50-day EMA upward on the daily chart with the attempt to break the distribution territory but sellers are putting more pressure on the pair, and the price is sliding downwards. The price is moving away from the 50-day EMA on the Daily chart with low momentum. The price has formed “Ascending Triangle” pattern, which connotes an upward breakout.
Distribution level of $110 has been tested by the coin, and a bearish retracement is possible (which is supposed to be temporary). The cryptocurrency is presently ranging within the Ascending triangle pattern. Should the strong distribution level get broken, the pair will experience upward movement and get exposed to another strong distribution level at $120. The MACD, with its histogram above the zero level, and the signal lines pointing upwards, indicates that the price may break out at distribution territories of $110.
XMR/USD Price Medium-term Trend: Bearish
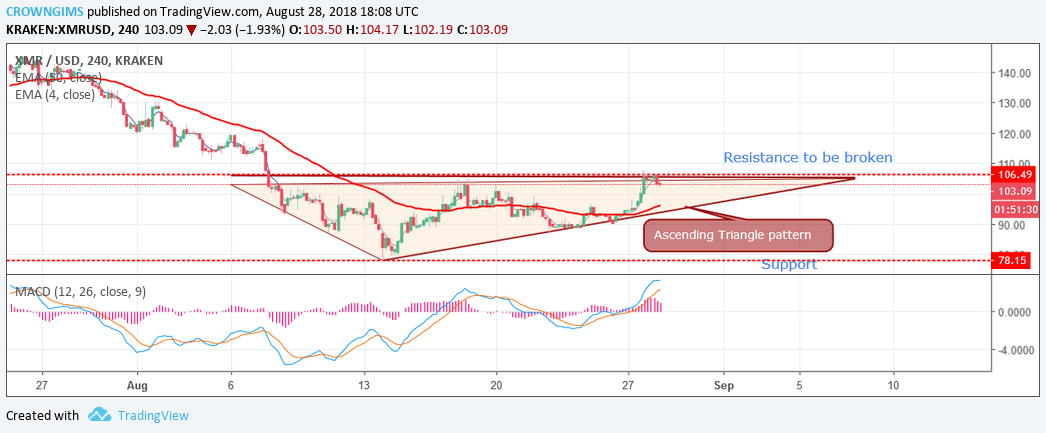 Monero on the 4-Hour chart formed “Ascending Triangle” pattern which indicates that there is a probability for the price to breakout at upper distribution territories this week. Should the coin breaks the lower trend line of the triangle, further downtrend movement could be experienced towards the accumulation territory of $70. The 4-day EMA is above the 50-day EMA and the price is above 4-day EMA, suggesting the upward movement this week.