
By
Bhushan Akolkar
April 22nd, 2024
Price is currently hovering within the boundaries of the resistance level at $6.8 and the support level at $4.1. It would take a strong directional movement for the price to leave the boundaries.
Key Highlights
Formation of “tweezers bottom” candles confirmed on the daily chart;
The price might go up this week;
A retest of the support level of $4.1 is possible.
EOS/USD Long-term Trend: Bearish
Resistance levels: $6.8, $9.4, $11.4
Support levels: $4.1, $2.0, $0.5
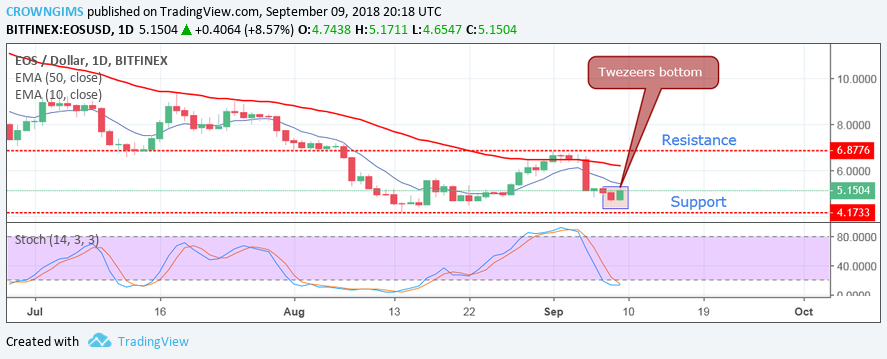
EOS/USD made an attempt to push higher last week above the resistance level of $6.8 but closed lower towards the support level of $4.1 with the formation of a strong bearish candle. More pressure from the seller pushed the price downward and was unable to break the nearest support level of $4.1. The price has kept ranging within the resistance level of $6.8 and support level of $4.1 on the daily charts for more than three weeks. If bears hold on the current price range, the current market situation will persist. Last week was bearish. As at present the price formed “tweezers bottom” candle which connotes the possibility of the price increase this week
The Stochastic Oscillator Period 14 on the daily chart is at oversold, below the level 20, with its signal lines pointing upwards, which indicates the probability of a bullish movement this week should the support level of $4.1 holds.
EOS/USD Price Medium-term Trend: Bearish
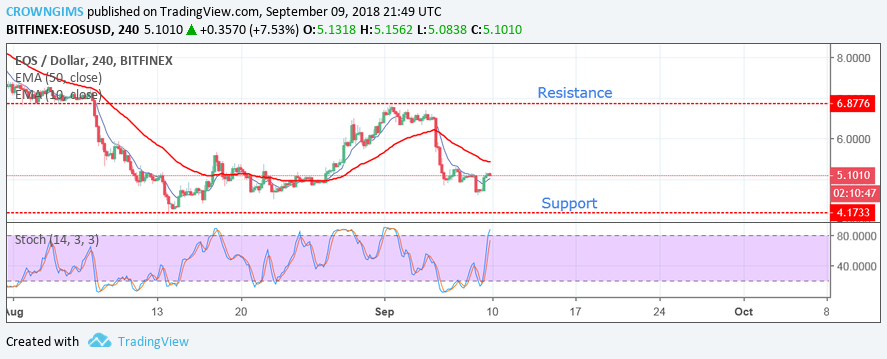
The coin is bearish on the medium-term outlook. The price has been moving downward with the formation of more bearish candles, which indicates that bears were in control of the price last week. Looking at the support and resistance levels, the price is currently hovering within the boundaries of the resistance level at $6.8 and the support level at $4.1. It would take a strong directional movement for the price to leave the boundaries. As the current position of the Stochastic oscillator suggests a temporal rise in momentum.
The 10-day EMA has crossed the 50-day EMA downward with the price below the 10-day EMA, confirming the downtrend. Should EOS price go up to the resistance level at $6.8 and produce a bullish pattern, then upward movement could be anticipated. A retest of the support level of $4.1 is possible.
Disclaimer: The views and opinions expressed here do not reflect that of Coinspeaker.com and do not constitute financial advice. Always do your own research. The charts for the analysis are provided by TradingView