
By
Svetlana Soroka
April 5th, 2024
The Bulls increased their momentum by the formation of bullish engulfing candle followed with the massive strong bullish candles; broke both supply levels of $0.21 and $0.24.
Key Highlights:
- Formation of head and shoulder pattern on 4-Hour chart;
- there is a possibility of further increase in price;
- traders should be patient and watch out for the price direction
XLM/USD Long-term Trend: Bullish
Supply levels: $0.24, $0.30, $0.35
Demand levels: $0.21, $0.18, $0.17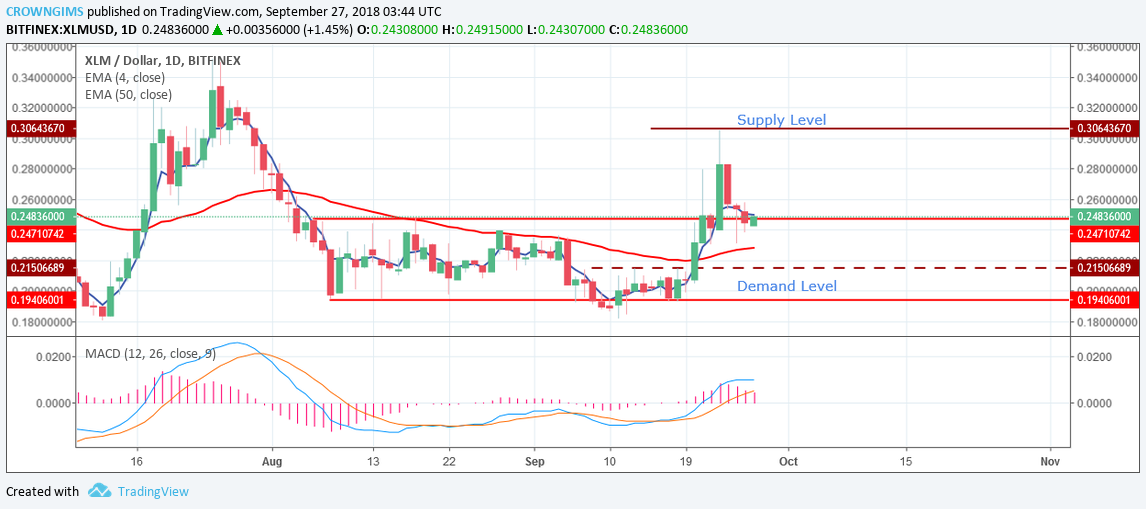 The coin successfully broke out of the ranging channel to the north as speculated last week, after several days of ranging and trading within the supply level of $0.21 of the upper range and the demand level of $0.18 of the lower range. The Bulls increased their momentum by the formation of bullish engulfing candle followed with the massive strong bullish candles.
The cryptocurrency was pushed up to break both supply levels of $0.21 and $0.24 last week. The price reached the upper supply level of $0.30 before it was pushed back by the bears to retest the demand level of $0.24.
The MACD indicator is above zero level with its signal lines pointing to the north which suggest buying signal. The first candle formed on the daily chart is bullish at the retesting demand level of $0.24 indicating a continuation of the uptrend movement. In case the bulls lose the momentum the price would be reduced to the demand level of $0.21.
XLM/USD Price Medium-term Trend: Bullish
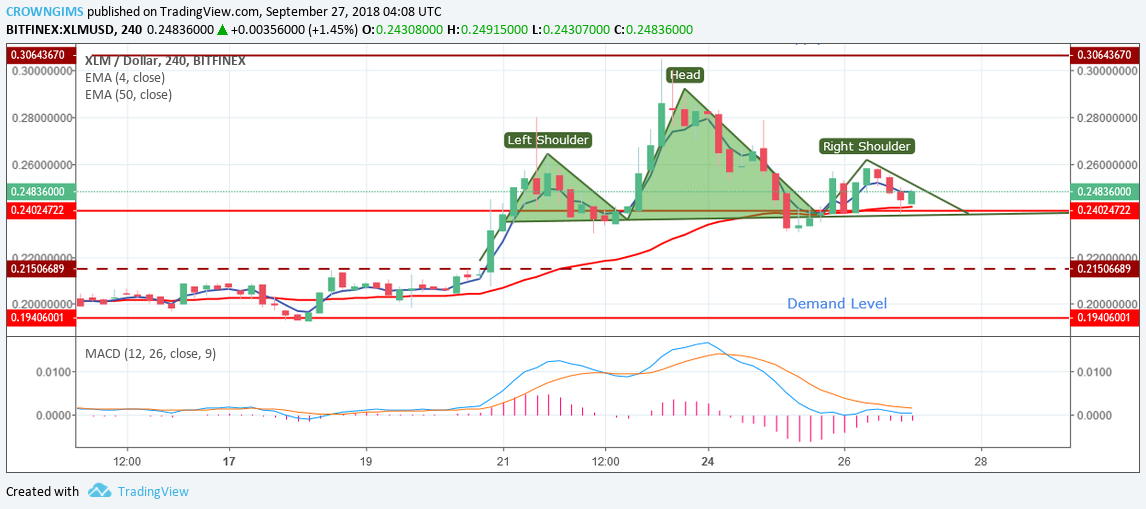 Stellar is bullish on the medium-term outlook. The bulls broke out the supply level of $0.21and $0.24 as their momentum gradually increased. The bulls’ pressure pushed price up toward the supply level of $0.24 due to the formation of bullish engulfing candles in the medium term, which means that bulls took control of the market last week.
As at present, the price has formed head and shoulder pattern with the neckline at the demand level of $0.24. The price will have to break the demand level of $0.24 for the downtrend movement occurrence and this will expose it to another demand level of $0.2. The price is between 4-day EMA and 50-day EMA, with MACD below zero and its signal lines parallel which indicates the possibility of the further uptrend. Traders should be patient and watch out for the price direction.