There is a probability for a breakout of the price from the resistance level of $0.028 in case the bulls increase their momentum.
Key Highlights:
- There is a tendency for the price retracement;
- in case bulls increase their pressure price will break out to the north;
- traders should trade patiently with discipline.
TRX/USD Long-term Trend: Bullish
Resistance levels: $0.028, $0.031, $0.041
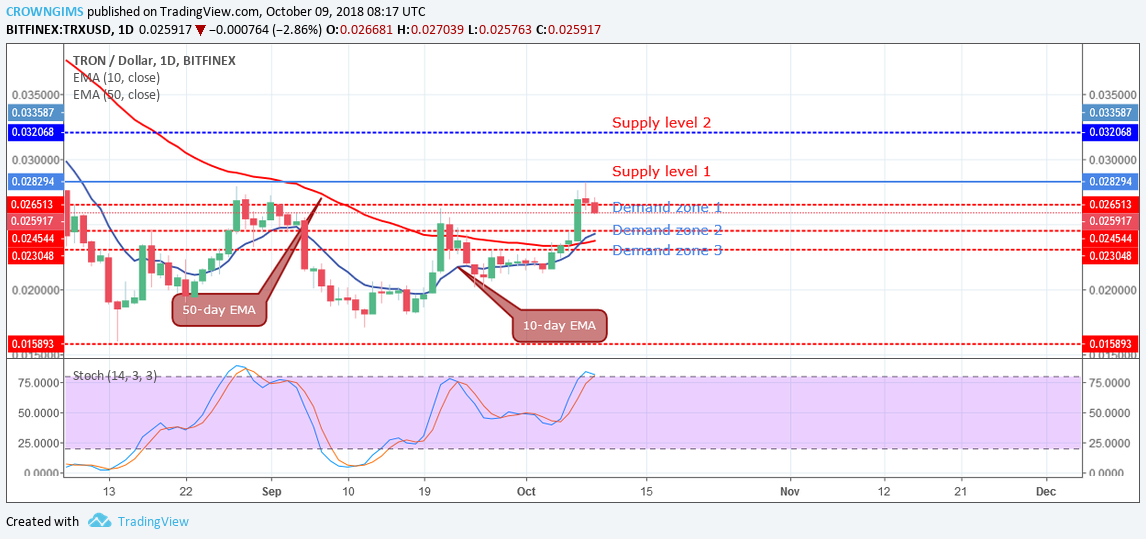
Support levels: $0.026, $0.024, $0.023 The coin was bullish in its daily chart last week. The strong bearish pressure was lost after a drop in the price of the cryptocurrency to the lower support level of $0.024. The bulls took over the market from the bears, confirmed by the formation bullish engulfing candle. The price was pushed up to the supply level of $0.26 and broke out rallied to the resistance level of 0.028. It made an attempt to break this barrier at $0.028 but the Bears prevailed over the market pushed it back gradually; this could be a kind of retracement.
Currently, the price is retesting the resistance level of $0.26. The 10-day EMA is below the price while 50-day EMA is below the 10-day EMA; which means there is a probability for a breakout of the price from the resistance level of $0.028. Should bears increase their momentum, the break out may occur at the lower support level of $0.024.
The Stochastic Oscillator Period 14 on the daily chart is above the 80 level with the signal lines pointing to the south, indicating that price may decrease.
TRX/USD Price Medium-term Trend: Bullish
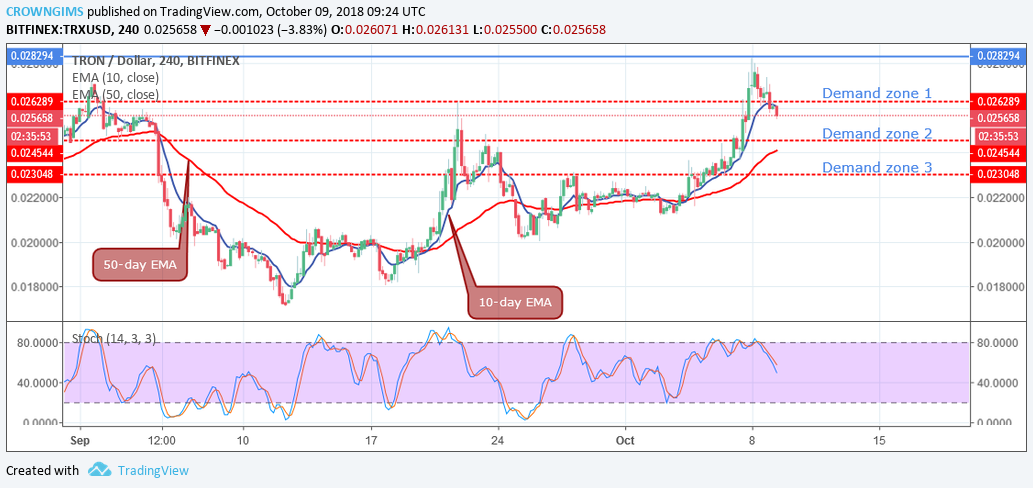
 On the 4-Hour chart, the price was bullish last week. Bulls came in after the consolidation at the demand level of $0.021.There was enough momentum for the buyers to break the resistance levels of $0.24 and $0.26. The price headed towards the upper resistance level of $0.028 yesterday. The bears came in and gradually pushing the price downward.
As at present the bears are in control of the market as the price is below 10-day EMA and the 50-day EMA below the price; it indicates that there could be a pullback movement before the continuation of an uptrend.
Should bears increase their momentum there is a probability that the price will experience downtrend movement towards the support level of $0.024. Nevertheless, the Stochastic Oscillator Period 14 is above 50 levels with the signal lines directed towards the south indicates a sell signal. Traders should trade patiently with discipline.
