
By
Svetlana Soroka
April 5th, 2024
The price broke the demand level of $0.24 and the downtrend movement was experienced and this exposed it to another demand level of $0.21.
Key Highlights:
- Further Downtrend movement may be experienced;
- there is a possibility of the price bounces from the support of $0.21;
- traders should be discipline in order to make green pips.
XLM/USD Long-term Trend: Ranging
Supply levels: $0.30, $0.35, $0.45
Demand levels: $0.24, $0.21, $0.18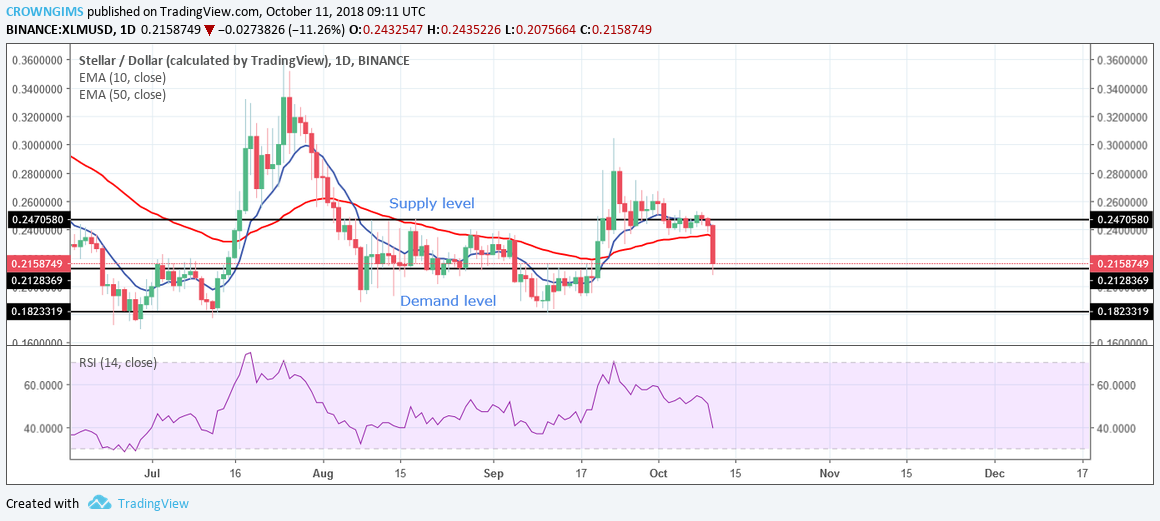 XLM/USD still consolidated last week in its long-term outlook. After a bearish run to the demand level of $0.24, bulls interrupted further downward movement, this was confirmed with the formation of a pin bar and a bullish candle as the bulls made a gradual return.
The daily opening candle on the daily chart was strong bearish candle which broke the supply level of $0.24 downward, moved the price towards the support level of $0.21. Should the bears increase their momentum the support level of $0.21 may not holds and XLM will break the level expose it to the lower support level of $0.18.
Meanwhile, XLM is below 50-day EMA and the 10-day EMA is above the 50-day EMA, it indicates a bearish movement. However, the RSI indicator is on the 40 levels with its signal lines pointing to the south which indicates selling signal and this is also supported by the opening bearish candle formed on the daily chart at the demand level of $0.24. In case the bears increase the momentum the price would break the demand level of $0.21 and expose to the demand level of $0.18. Taking short trade is logical.
XLM/USD Price Medium-term Trend: Ranging
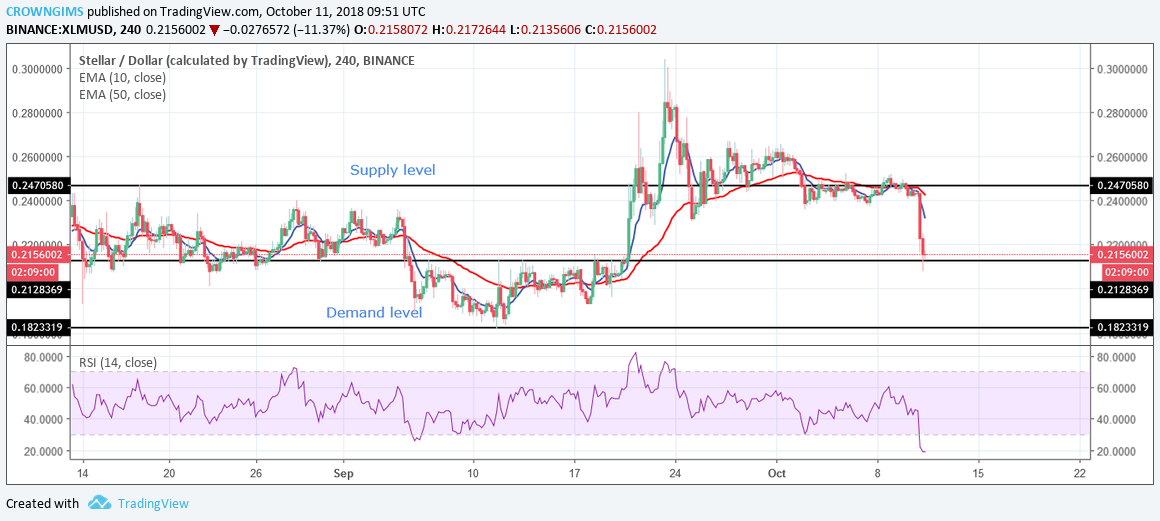 Stellar was ranging on the medium-term outlook and still continues till October 10. The sideways movement which commenced shortly after the bulls broke out the supply level of $0.21 and the price was pushed up toward the supply level of $0.3 where it was rejected by the bears’ pressure to the demand level of $0.24.
The Bears increased their momentum and broke the supply level of $0.24 downward, the price was pushed down below the support level of $0.21.
Should the price break the demand level of $0.21further downtrend movement will be experienced and this will expose it to another demand level of $0.18. Stellar is below 10-day EMA and 50-day, with the RSI period 14 is on 20 levels with its signal lines point to the north indicates the possibility of the uptrend movement. Discipline and patience is the key to green pips.