
By
Kseniia Klichova
December 14th, 2023
In case the bears were able to break downside the demand zone of $0.027 then it will have its low at $0.022. Else, the Cardano price will bounce and rally to the north to have $0.032 – $0.042as its target.
Key Highlights:
- The Bears were in control of Cardano market;
- the Bulls lost the pressure;
- the bearish movement continues on the ADA market.
ADA/USD Price Long-term Trend: Bearish
Supply Zones: $0.032, $0.042, $0.050
Demand Zones: $0.027, $0.022, $0.016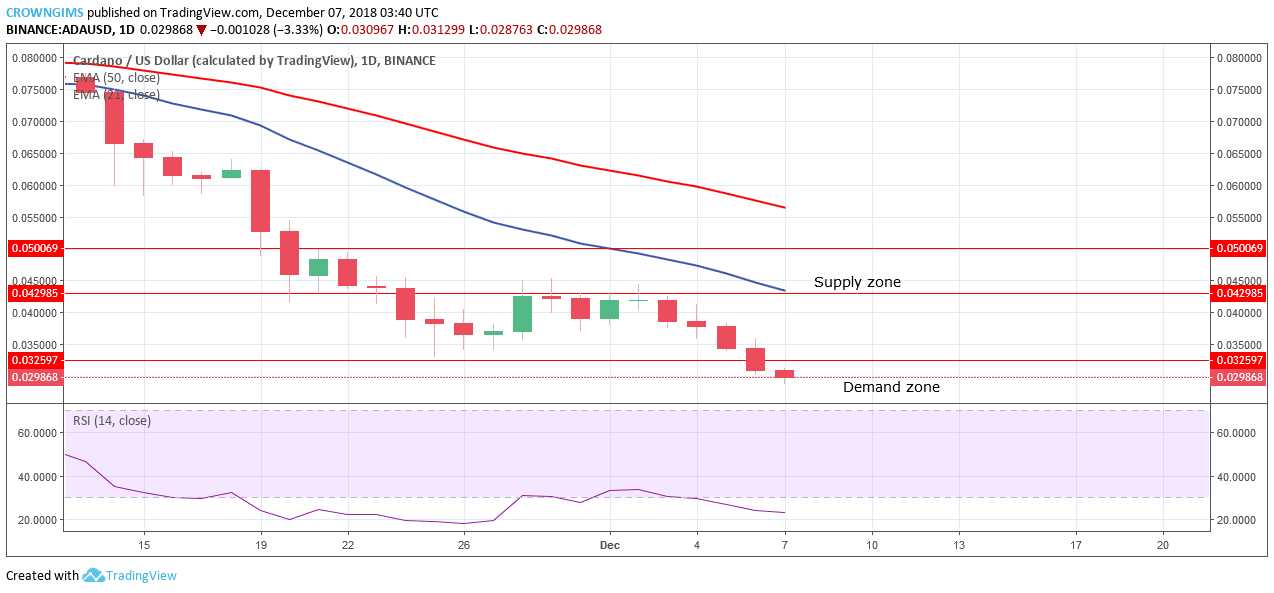 Cardano continues in its downtrend movement on the daily chart. On November 28, an attempt was made by the bulls to push ADA price up above the supply zone of $0.042, the bears rejected it and a Doji candle formed that led to consolidation for four days. The bears gained momentum and were able to continue its bearish trend. The bears maintain their pressure and were able to break downside the former demand zone of $0.032.
ADA formed a daily bearish candle that penetrated and closed below the $0.032 demand zone. As at the time of writing, another daily bearish candle is forming coupled with the Cardano price trading below 21-day EMA and the 50-day EMA, shows that Cardano is under the Bears’ pressure.
Meanwhile, the Relative Strength Index (RSI) is below 30 levels which point down indicates the downtrend may continue for a while. In case the bears were able to break downside the demand zone of $0.027 then it will have its low at $0.022.
ADA/USD Price Medium-term Trend: Bearish
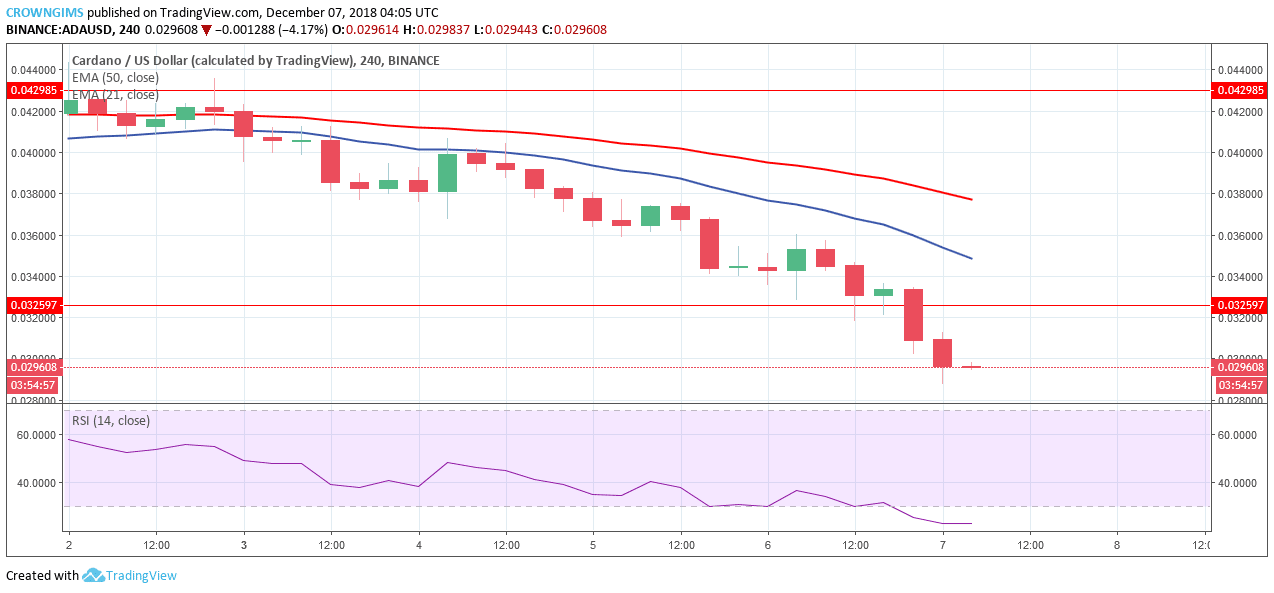 ADA is on the bearish trend on the medium-term outlook. The coin broke out of the consolidation on December 3 and pushed the cryptocurrency below the two EMAs. An attempt to return the coin to its previous high was resisted by the bears and the price is making lower lows in the ADA market.
Cardano price is currently distance from the two EMAs, it is trading below the 21-day EMA and 50-day EMA; this confirms the strong pressure of the bears in the ADA market. The Relative Strength Index period 14 is below 30 levels pointing to the south connotes sell signal.
Should the demand zone of $0.027 holds, the price will bounce and rally to the north to have $0.032 – $0.042as its target.