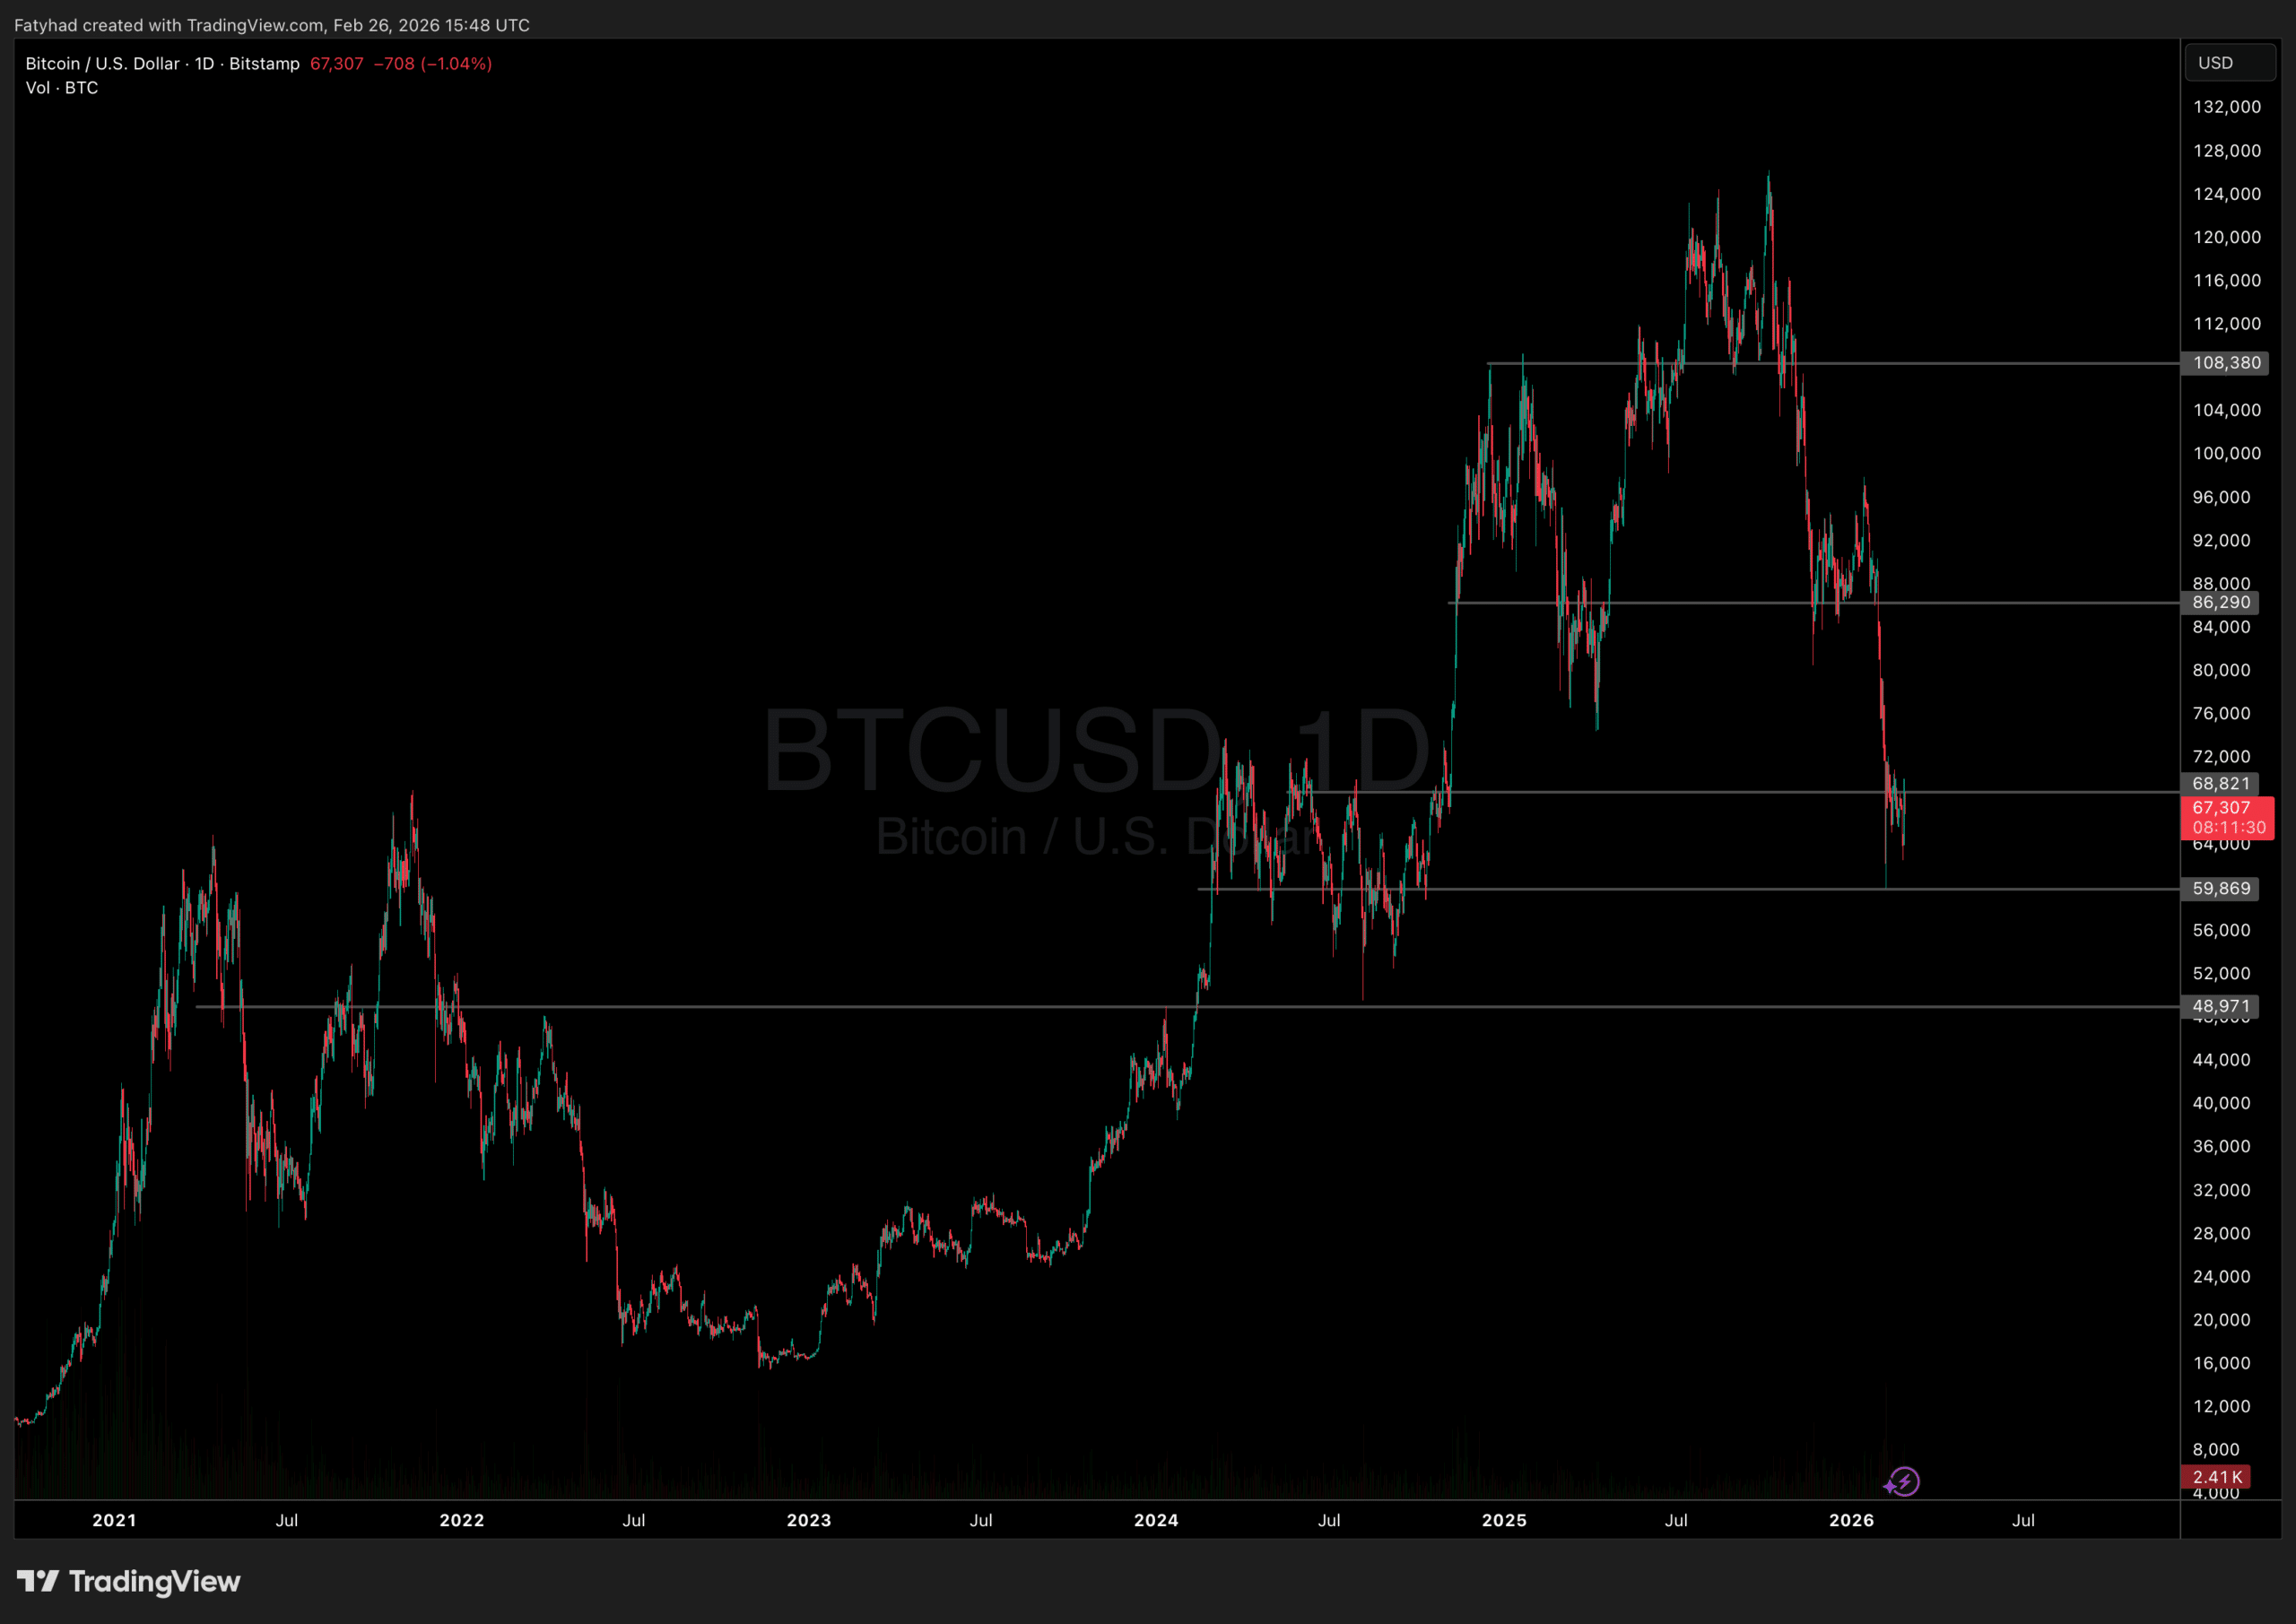
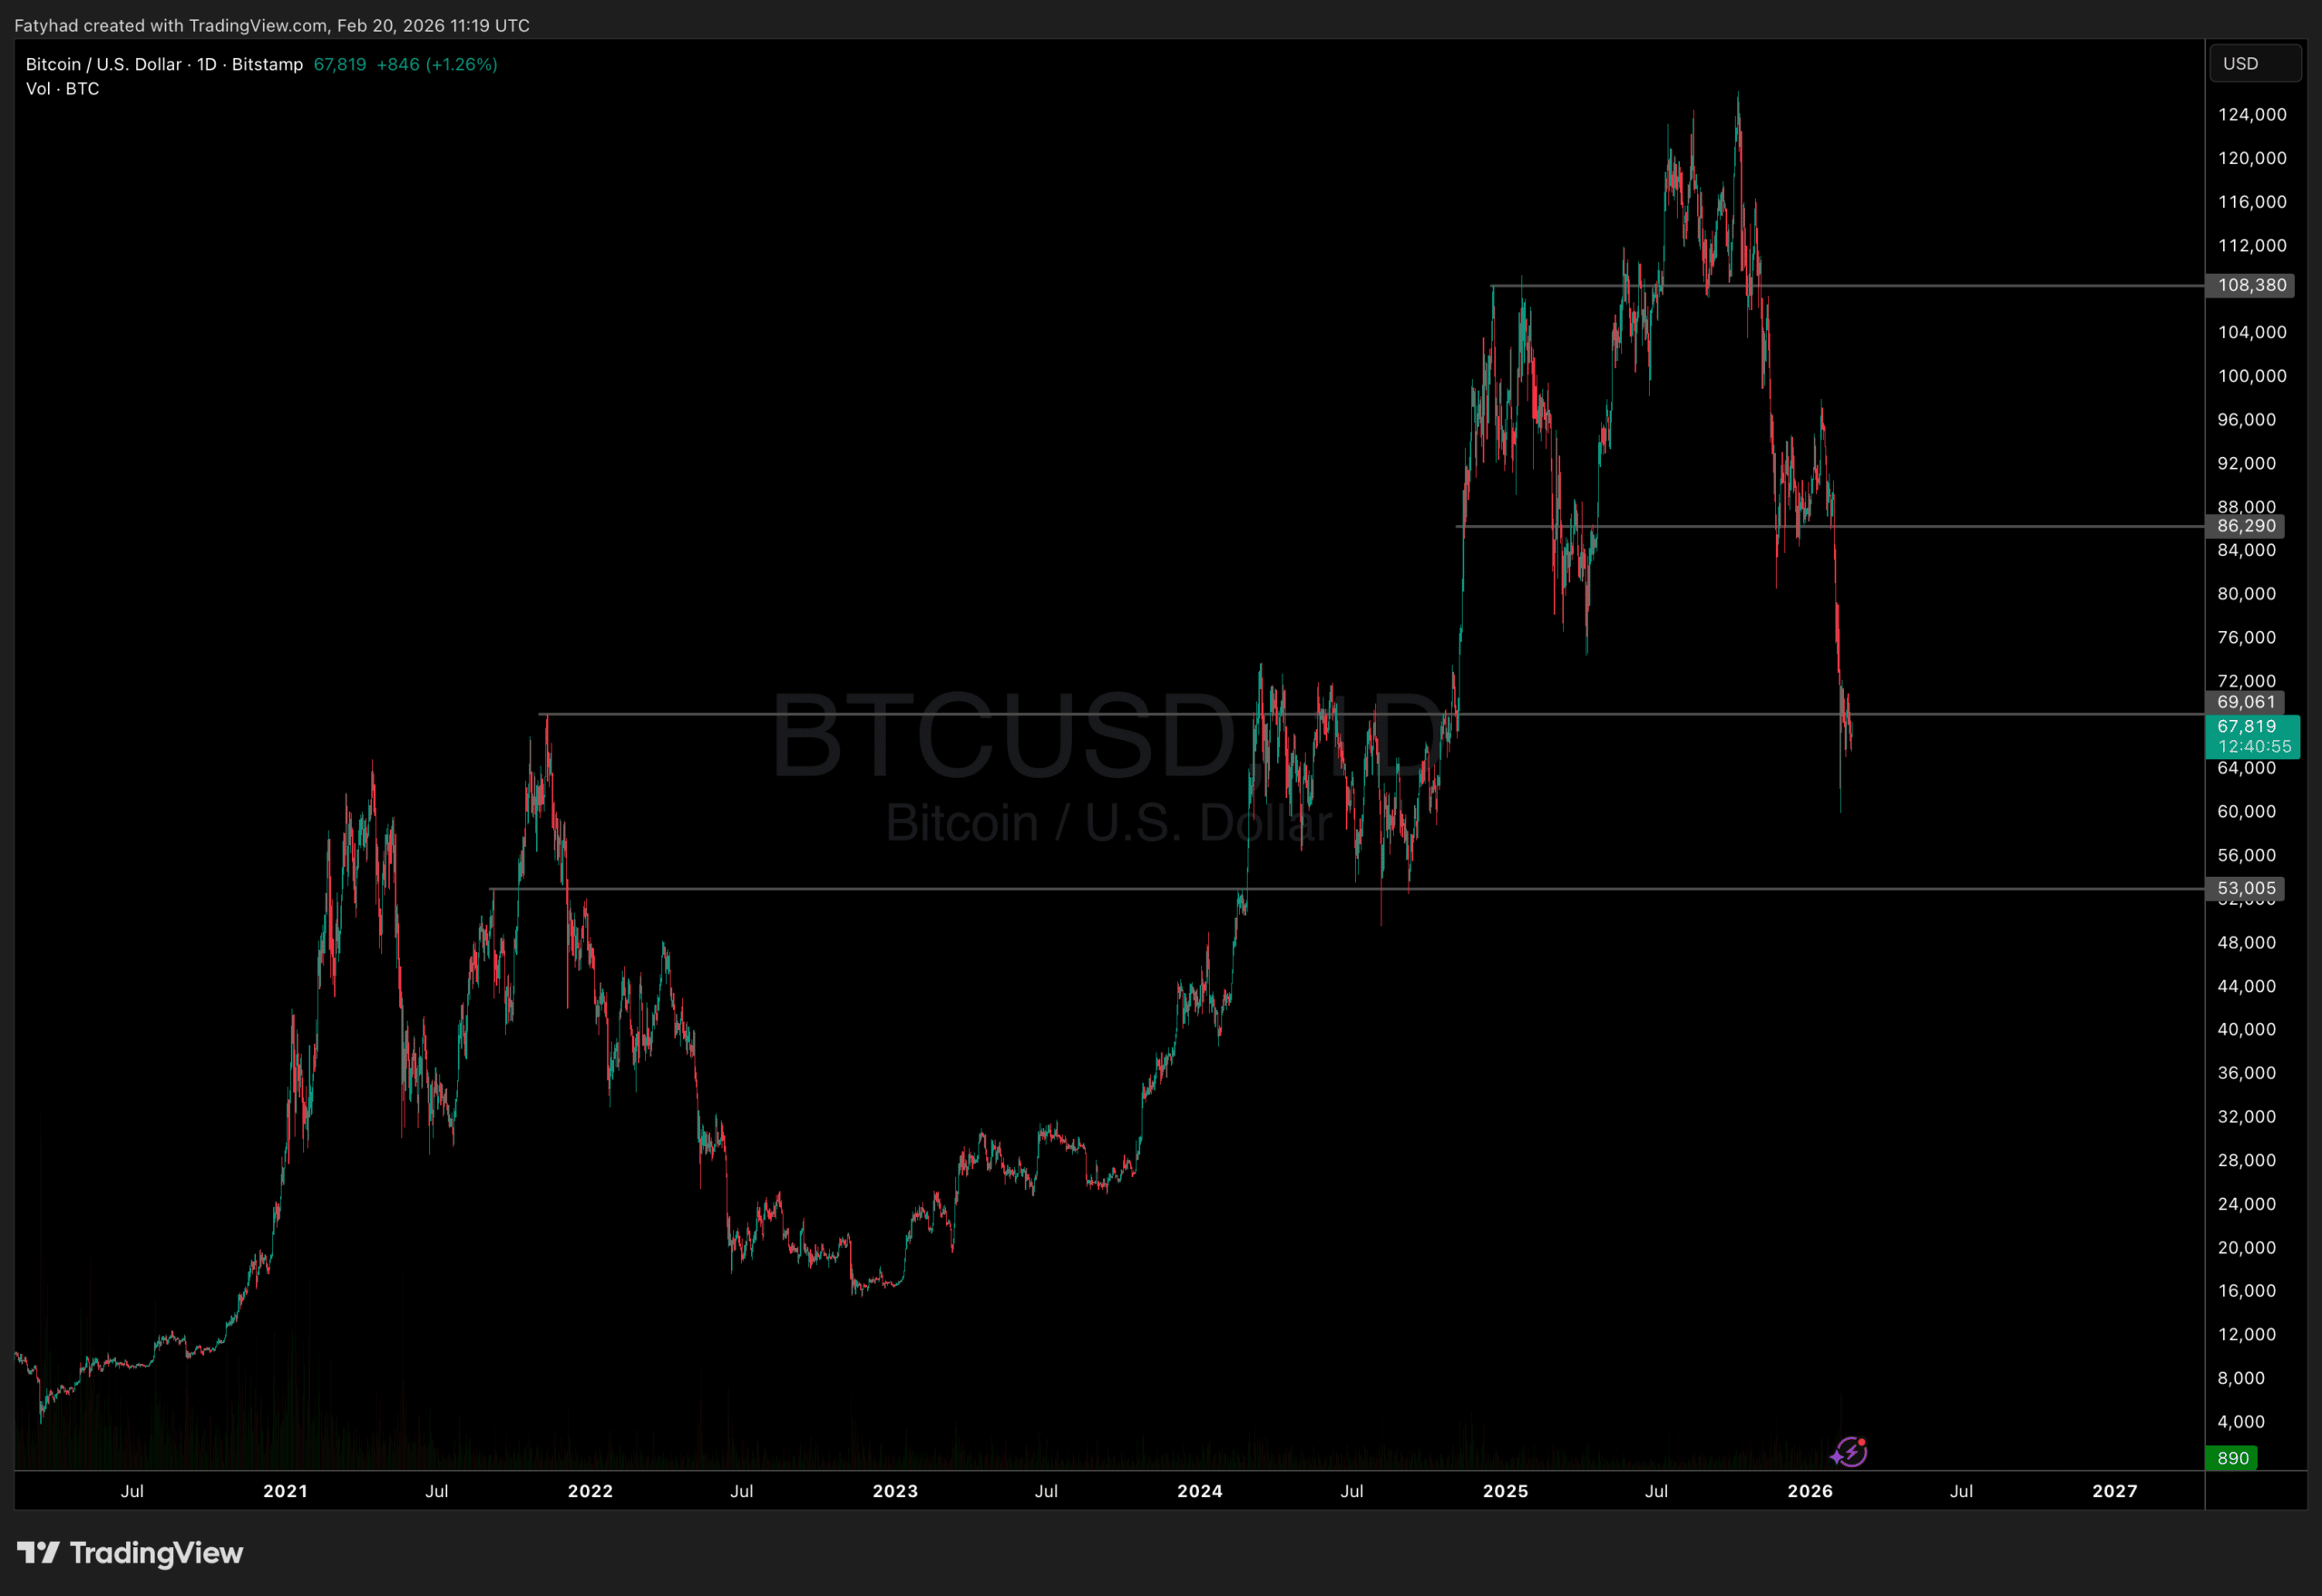
Bitcoin’s ratio to gold hits 18.17, the richest since January, as fiscal debasement fears drive both assets. BTC price analysis plus early-stage Layer 2 presale context.
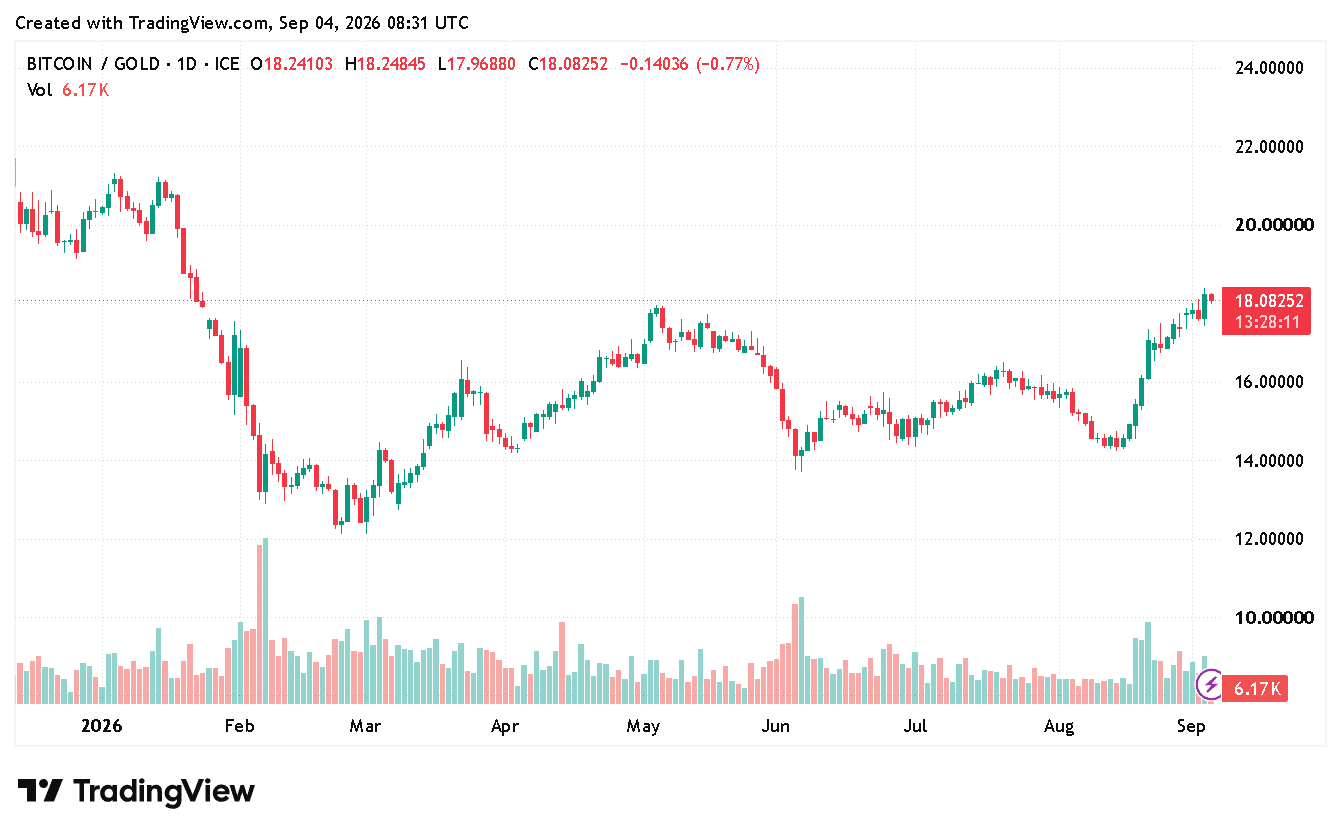
Bitcoin (BTC) is changing hands around $80,724, down 0.93% over the past 24 hours, a modest pullback, and certainly one that doesn’t dent the bigger story unfolding against gold. One Bitcoin now buys roughly 18.17 ounces of the metal, the richest ratio since January, per TradingView figures. There’s a number further down worth watching too — an analyst call that puts this ratio far higher before the year is out.
The catalyst isn’t yield curves or rate-cut odds. It’s fiscal arithmetic. Every major advanced economy except Switzerland now carries a debt-to-GDP ratio above 100%, and the U.S. leads on primary deficit, the shortfall once interest payments are stripped out.
U.S. Treasury Secretary Scott Bessent told the G20 finance ministers’ meeting in Asheville, North Carolina, this week that “the world is awash in debt… and the only way for us to get out of this is to grow our way out of this.”
SkyBridge Capital’s Anthony Scaramucci turned that line into a pointed rebuttal on X, calling it “the best Bitcoin ad of the year” — delivered, he noted, by twenty finance ministers who didn’t mean to make it.
Both assets are rallying on the same debasement thesis after lagging the AI-driven equity boom for most of the year. That macro pressure has shaped Bitcoin’s price action for weeks, and the gold ratio is now the cleanest single-number way to track it.
Can Bitcoin Price Hold $80,000 This Week?
Bitcoin is trading near $80,724 after a shallow overnight dip, with intraday sessions this week touching as high as $81,596 on Investing.com’s feed and $82,121 on Binance’s. Bloomberg’s crypto desk has flagged $80,000 as the level where “rally momentum cools”, a resistance zone tested repeatedly rather than cleanly broken.
On the hourly chart, Investing.com noted the Money Flow Index (MFI) pinned at 100 during the recent spike to $81,336, a textbook overbought signal that tends to precede consolidation, not necessarily reversal.
Support sits in the $78,000–79,000 band, and the zone regulatory-driven pullbacks have repeatedly found buyers.
Bull case: a clean break above $82,000 opens room toward the psychological $85,000 mark, especially if the debasement narrative keeps pulling capital from bonds.
Base case: range-bound chop between $78,000 and $82,000 while traders digest the overbought hourly signal.
Bear case: a Bank of Japan hawkish surprise or a stronger dollar print sends BTC back toward $75,000, echoing prior sell-offs tied to central bank commentary.
Bitcoin Hyper Targets Early Mover Upside as Bitcoin Tests Key Levels
An 18-to-1 gold ratio is historically rich, but it also means the easy multiple is gone. Buying Bitcoin at a $1.6 trillion market cap for outsized asymmetric return is a different bet than it was in 2020.
That math is pushing traders further down the risk curve, toward Bitcoin’s own infrastructure layer, the part of the ecosystem still priced like an early bet rather than a macro hedge, and worth comparing against how Bitcoin ETFs have reshaped exposure to the asset more broadly.
Bitcoin Hyper (HYPER) is positioning itself as the first Bitcoin Layer 2 with Solana Virtual Machine (SVM) integration, aiming for execution speeds faster than Solana itself. The presale token sits at $0.0136857, with $33,104,187.09 raised so far.
The pitch: low-latency Layer 2 processing, a decentralized canonical bridge for native BTC transfers, and staking rewards at an unspecified but advertised high APY (annual percentage yield). It’s an attempt to bring programmable smart contracts to Bitcoin without touching its base-layer security model – ambitious, and unproven at scale, which is the risk that comes with any presale.
Those tracking the BTC/XAU ratio as a signal of capital rotation may want to research Bitcoin Hyper directly.
Disclaimer: Coinspeaker is committed to providing unbiased and transparent reporting. This article aims to deliver accurate and timely information but should not be taken as financial or investment advice. Since market conditions can change rapidly, we encourage you to verify information on your own and consult with a professional before making any decisions based on this content.
Daniel Frances is a technical writer and Web3 educator specializing in macroeconomics and DeFi mechanics. A crypto native since 2017, Daniel leverages his background in on-chain analytics to author evidence-based reports and deep-dive guides. He holds certifications from The Blockchain Council, and is dedicated to providing "information gain" that cuts through market hype to find real-world blockchain utility.
Arthur Hayes warns $1.5 trillion in AI debt risks a credit crisis dwarfing 2008, forcing money printing that rotates into Bitcoin at $1 million per coin.
BitMEX co-founder and Maelstrom chief investment officer Arthur Hayes, speaking on the Bankless podcast on June 22, 2026, argued that roughly $1.5 trillion in AI-related debt issued since late 2022 has absorbed nearly all of the U.S. M2 expansion over the same period – starving Bitcoin of liquidity and setting up a credit crisis he expects to dwarf the 2008 subprime collapse, with a terminal Bitcoin price target of $1 million per coin.
This is not simply a price call. It is a structural thesis about capital misallocation at a scale Hayes argues the financial system has not previously encountered, with Bitcoin as the residual beneficiary of the inevitable policy response.
The AI Credit Crisis Mechanism: How GPU Debt Becomes a Systemic Risk
The mechanism functions as follows: capital that might otherwise have bid on Bitcoin has instead been routed into data center build-outs and GPU clusters financed with multi-year debt. Hayes described the AI capex boom as potentially larger than the 19th-century railroad build-out as a share of global GDP – and structurally similar in its eventual failure mode. He specifically flagged GPU loan mismatches, where financing is amortized over five to six years while leading AI hardware becomes functionally obsolete for frontier workloads in roughly two years.
The second transmission channel Hayes identified is competitive pricing pressure from Chinese AI models. If U.S.-built AI services are forced to match Chinese pricing, the cash flow assumptions underpinning those GPU loans deteriorate rapidly. As Hayes characterized it on the podcast, that repricing of cash flows becomes a credit event – and as a credit event, it would be bigger than subprime.
This dynamic is not purely speculative. A Bank for International Settlements (BIS) bulletin on AI-related private credit documented that this asset class has grown from near zero to over $200 billion, representing nearly 8% of total private credit – with hyperscalers increasingly moving AI infrastructure debt off balance sheets via special-purpose vehicles and operating leases, creating what the BIS describes as hidden transmission channels for shocks.
Money Printing as the Policy Response: Why Bitcoin Captures the Rotation
Hayes’ argument is that when the AI credit cycle turns, the initial policy reflex will be familiar: central banks and fiscal authorities will inject liquidity to stabilize the banking system. His language from the podcast was direct – authorities will attempt to “shovel fiat money in” to arrest a crisis he described as six to seven years of gross capital misallocation in the making.
The critical variable is where that liquidity lands. Hayes argued that once investors have experienced AI-related losses at scale, new capital – whether cheap or not – will not rotate back into AI because the sector will no longer meet its cost of capital. The alternative destination, in his framing, is crypto. He noted in the podcast that this capital “goes straight to crypto,” implying Bitcoin absorbs a disproportionate share of crisis-era money printing precisely because it sits outside the institutions and asset classes damaged by the unwind.
A $1 million Bitcoin implies a network value of approximately $21 trillion – a figure that requires the kind of emergency liquidity injection that dwarfs the COVID-era response. Hayes is not presenting this as a base case with a defined timeline; he acknowledged on the podcast that the AI bubble unwind could arrive “this fall” or “years from now.” The macro thesis requires crisis-scale capital creation, not the gradual monetary expansion currently underway.
Bull and Bear Paths: What Confirms or Breaks the Thesis
The confirmatory condition for Hayes’ scenario is a cascade of defaults or impairments in AI-linked private credit – particularly among mid-tier GPU lenders and leveraged data center operators – that forces a policy response large enough to materially expand central bank balance sheets. In that scenario, and if institutional capital treats Bitcoin as a debasement hedge rather than a risk asset, the liquidity rotation Hayes describes becomes structurally plausible.
The invalidation path is equally clear: emergency liquidity in a credit crisis historically flows first to Treasuries, gold, and perceived safe havens. Bitcoin’s correlation with risk assets during the acute phase of a credit event – as demonstrated in March 2020 – would work against Hayes’ destination thesis in the early stages of any unwind. We suspect the more probable near-term outcome is that Bitcoin sells off alongside AI-linked equities in the initial shock before any rotation into scarce assets materializes.
Hayes’ own positioning as of the June 2026 interview is instructive: he described himself as “perennially long Bitcoin” while holding significant cash in T-bills and having recently reduced exposure to higher-beta tokens including NEAR and Hyperliquid. Capital preservation over appreciation, he noted, is how he has kept “most of his money” across multiple cycles. The $1 million thesis is a cycle-peak target, not a near-term trading position – and Hayes himself frames it as a probabilistic macro outcome dependent on a sequence of events that has not yet begun in earnest.
The analytical question is no longer whether AI capital spending is unusually leveraged – the BIS documentation of shadow AI borrowing confirms it is. The question is whether the credit event Hayes anticipates arrives with enough severity to force a policy response at the scale his Bitcoin price prediction requires, and whether that response reaches Bitcoin before it reaches everything else.
Disclaimer: Coinspeaker is committed to providing unbiased and transparent reporting. This article aims to deliver accurate and timely information but should not be taken as financial or investment advice. Since market conditions can change rapidly, we encourage you to verify information on your own and consult with a professional before making any decisions based on this content.
Daniel Frances is a technical writer and Web3 educator specializing in macroeconomics and DeFi mechanics. A crypto native since 2017, Daniel leverages his background in on-chain analytics to author evidence-based reports and deep-dive guides. He holds certifications from The Blockchain Council, and is dedicated to providing "information gain" that cuts through market hype to find real-world blockchain utility.
Bitcoin (BTC) briefly reached above $65,000 on July 15, 2026, according to CoinGecko data, with the rally occurring alongside softer-than-expected US inflation data that eased pressure on the Federal Reserve, even as fresh US–Iran airstrikes continued following President Trump’s strike orders the prior weekend.
The BTC price had already recovered above $63,000 within days of those strikes, and the lack of downside movement whenever the latest conflict is reported in the Middle East suggests investors are reacting less out of fear.
This is not simply a resilience narrative. It is evidence that the geopolitical risk premium attached to Iran headlines has materially decayed, with the shock absorption now occurring inside derivatives markets rather than through spot capitulation.
With the $65,000 level touched, a flip to support on the daily close is prompting several analysts to call for a $70,000 retest this week as the bullish structure continues to form on the BTC chart.
Iran Airstrikes: The Diminishing Shock Response in BTC Price
Complex inverse H&S breakout with a target north of $70K.
The shakeout into CPI formed a second right shoulder with a perfect retest of the diagonal, then it followed through with a clean break above the horizontal neckline.
The contrast with the June 2025 Iran episode is instructive. When similar strikes hit that summer, BTC fell below $99,000, its lowest level since May 2025, with more than $1Bn in crypto liquidations in 24 hours, over 95% of which were longs, as reported by CNBC.
This July, total BTC liquidations tied to Iran headlines were modest compared with the earlier June 2025 Iran shock, consistent with trimming rather than capitulation.
The geopolitical risk premium has not disappeared; it has migrated. Derivatives data showed the impact flowing into options-implied volatility and put skew rather than triggering broad spot deleveraging.
Yet the highest 24-hour BTC options volume sat at the $80,000 call strike, a positioning pattern that signals traders are hedging near-term downside while remaining structurally positioned for upside.
As BeInCrypto’s Darryn Pollock wrote on July 15, “traders appear to be growing desensitized to the tit for tat in the Middle East rather than panicking every time tensions flare.”
The weekend microstructure reinforces this: BTC remains the first target for panic flows, but those flows have been shallower and shorter-lived with each successive Iran cycle.
South Korea: KOSPI Bear Market Accelerates Crypto Rotation
BLOODBATH IN SOUTH KOREA AGAIN 🚨
The KOSPI just crashed -5.66%, wiping out nearly ₩300 trillion from it's market value in just last 2 hours. pic.twitter.com/n7ERq1eUtq
The most structurally significant flow data in this cycle is coming from South Korea. The KOSPI has entered a technical bear market, down more than 20% from its June record. Samsung and SK Hynix together account for roughly half the index’s total weight. eToro market analyst Zavier Wong noted that a sharp swing in either name now drags the whole index with it.
SK Hynix’s chart illustrates the AI valuation debate in compressed form. The stock climbed approximately 233% from the start of 2026 to a record high on June 25 before retreating more than 34% by July 13. Its $26.5Bn American depositary receipt (ADR) listing on Nasdaq on July 10 – one of the largest foreign listings in US history has only sharpened investor scrutiny over how much AI memory chip demand is already priced in.
As the KOSPI rout deepened, trading volume on Upbit, South Korea’s largest crypto exchange, surged 1,318% in 24 hours to $4.2Bn, according to BeInCrypto. XRP recorded higher trading volume on Upbit than Bitcoin did during that window, a data point consistent with altcoin rotation signals visible elsewhere: the Altcoin Season Index has climbed to 58, while Bitcoin dominance has slipped toward key support.
The quality of those Korean flows warrants scrutiny. Korea’s Financial Supervisory Service (FSS) flagged that 1.2 million leveraged accounts triggered margin calls during the same period, a reminder that a portion of the Upbit volume surge reflects forced selling from equity margin calls being recycled into crypto, not purely conviction-driven rotation. The two dynamics are not mutually exclusive, but conflating them overstates the bullish signal.
— Crypto News Hunters 🎯 (@CryptoNewsHntrs) July 15, 2026
The analytical question is no longer whether crypto reacts to Iran headlines; it is whether the bid arriving into BTC and altcoins represents durable rotation or exhaustion-driven allocation.
As Pollock characterized it in the BeInCrypto piece, “Crypto looks less like an asset caught in the crossfire. It looks more like the place traders go when headlines get tiring, whether from Tehran or Seoul’s chip floor.”
That framing cuts both ways. An exhaustion bid can support prices in the near term while building fragile positioning that unwinds quickly if a genuinely novel shock arrives; a sustained Strait of Hormuz disruption that pushes oil meaningfully higher and reignites CPI pressure.
For instance, it would test whether the current implied volatility surface is adequately pricing tail risk. For now, the data supports the Iran fatigue thesis. Whether it persists depends on the novelty of the next headline, not its geography.
Disclaimer: Coinspeaker is committed to providing unbiased and transparent reporting. This article aims to deliver accurate and timely information but should not be taken as financial or investment advice. Since market conditions can change rapidly, we encourage you to verify information on your own and consult with a professional before making any decisions based on this content.
Daniel Frances is a technical writer and Web3 educator specializing in macroeconomics and DeFi mechanics. A crypto native since 2017, Daniel leverages his background in on-chain analytics to author evidence-based reports and deep-dive guides. He holds certifications from The Blockchain Council, and is dedicated to providing "information gain" that cuts through market hype to find real-world blockchain utility.
Bitcoin trades near $62,691, down 4.8% over seven days, as tech stock weakness pressures support at $61,862. Key levels, three price scenarios, and what breaks the range.
The Bitcoin price is trading around $62,600 on CoinGecko, flat on the day and down 4.5% over the past seven days, as risk-off sentiment bleeds from tech equity markets into crypto. The question traders are now working through is: does this consolidation hold, or does the structure crack, leading to a deeper retracement?
The weakness is not driven by a single catalyst. It is the cumulative weight of softer macro conditions, with tech stocks pulling back and reducing appetite for high-beta assets across the board. Macro stress has a documented transmission effect on Bitcoin pricing, and the current setup reflects that pattern.
BTC failed to hold intraday highs near $63,655, CoinGecko’s recorded 24-hour high, and has since drifted back toward the lower end of its recent range. The immediate task for bulls is stabilization, not momentum.
$BTC Low timeframe chopping around and starting to form this falling wedge pattern.
This is on top of high timeframe support with the big $60K area below and the Weekly 200MA.
But the bigger trend is obviously still down so it's best to wait for these structures to actually… pic.twitter.com/jsm6AwZYMj
Can Bitcoin Price Defend $62,000 Support Before Tech Sentiment Worsens?
Bitcoin is consolidating in the $62,000–$63,000 band, with the 24-hour low registered at $61,862 representing the clearest near-term support floor. A sustained break below that level opens a path toward prior congestion zones that have not been tested in recent sessions.
Resistance sits at $63,655, and reclaiming that level with conviction would be the minimum requirement for a bullish structure to reassert itself. Right now, the price is doing neither; it is grinding sideways with a mild downward lean.
Volume context reinforces caution. The 7-day trend shows a consistent pattern of lower highs rather than accumulation, suggesting sellers are absorbing relief rallies rather than stepping aside.
Three scenarios frame the range:
Bull case: BTC holds $61,862, tech sentiment stabilizes, and price reclaims $63,655 within the next two sessions, resetting momentum.
Base case: Choppy consolidation between $61,800 and $63,600 persists, with no directional resolution until a macro catalyst forces a breakout or breakdown.
Bear case: A daily close below $61,800 invalidates the support thesis and likely targets the mid-$59,000 area, where structural demand has historically appeared.
The realized P&L distribution among short-term holders is not favorable at current prices; prior analysis of on-chain data shows that capitulation-ratio stress tends to accelerate once spot crosses below short-term holders’ cost basis.
Bitcoin Hyper Draws Early Capital as Bitcoin’s Layer 2 Race Accelerates
For some participants, spot Bitcoin price underperforming its recent range is a prompt to look earlier in the risk curve, where the asymmetry is structurally different.
That rotation logic does not require BTC to fall further; it is simply the math of entry price versus potential displacement. Buying BTC at $62,000 with its existing market cap versus buying infrastructure at presale pricing are entirely different bets.
Bitcoin Hyper ($HYPER) is positioning itself as the first Bitcoin Layer 2 with Solana Virtual Machine (SVM) integration, targeting the core limitations that have constrained Bitcoin’s programmability: slow finality, high fees, and limited smart contract functionality.
The project has raised $32,877,175.53 at a current presale price of $0.0136821, with staking available for participants. The SVM integration is the structural differentiator.
It’s a technically ambitious claim to run Solana-grade execution speed within Bitcoin’s security perimeter, and the degree to which the team delivers on sub-second finality will determine whether this captures developer attention post-launch.
Disclaimer: Coinspeaker is committed to providing unbiased and transparent reporting. This article aims to deliver accurate and timely information but should not be taken as financial or investment advice. Since market conditions can change rapidly, we encourage you to verify information on your own and consult with a professional before making any decisions based on this content.
Daniel Frances is a technical writer and Web3 educator specializing in macroeconomics and DeFi mechanics. A crypto native since 2017, Daniel leverages his background in on-chain analytics to author evidence-based reports and deep-dive guides. He holds certifications from The Blockchain Council, and is dedicated to providing "information gain" that cuts through market hype to find real-world blockchain utility.
Bitcoin (BTC) trades at around $65,000 on June 17, down roughly -2.5% in the past 24 hours, as the Federal Open Market Committee (FOMC) convenes for its first meeting under new Federal Reserve Chair Kevin Warsh.
The rate decision itself was already a foregone conclusion, and the real market event concentrated entirely on whether Warsh would, as anticipated, refuse to submit his personal dot-plot projection.
This is not simply a procedural quirk from an idiosyncratic new chair. It is a potential regime change in how the world’s most systemically important central bank communicates.
And the structural consequences for crypto markets, Treasury pricing, and Bitcoin’s long-run value proposition are distinct enough to warrant separating the short-term noise from the durable signal.
Dot Plot Mechanics: Why Removing the Anchor Creates Immediate Turbulence
Since Ben Bernanke introduced the dot plot in 2012, Wall Street has relied on individual policymakers’ rate projections to influence Treasury yields, corporate loan spreads, and IPO valuations, with SpaceX cited as a notable example.
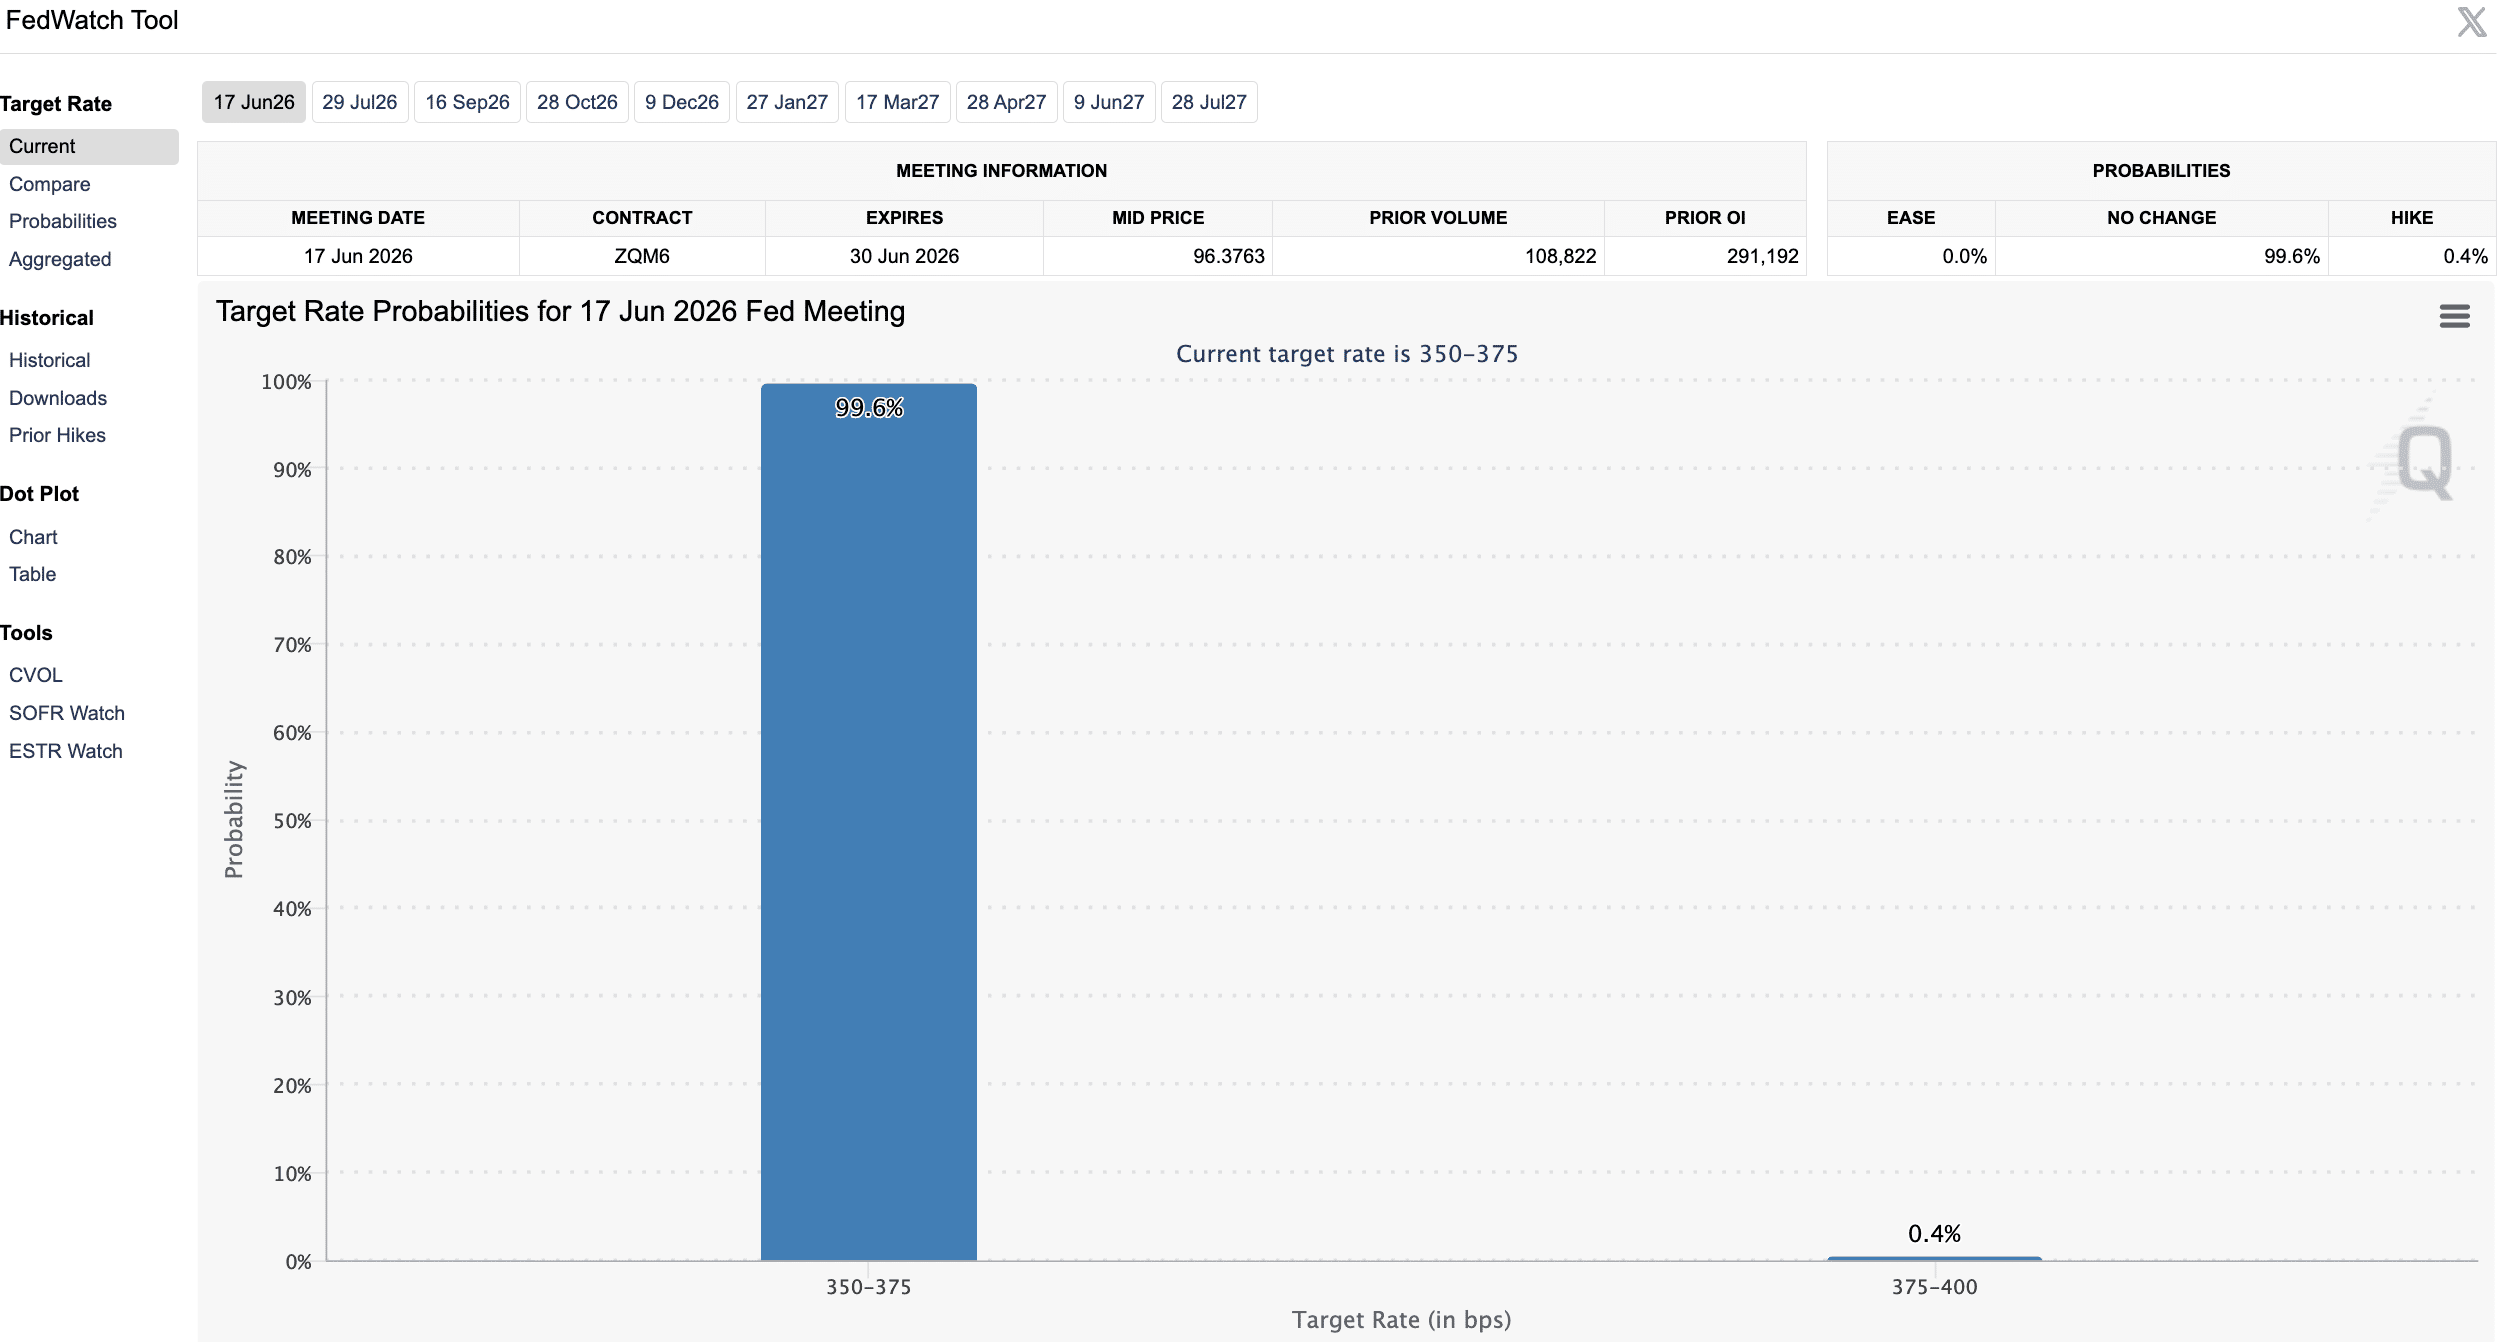
As of June 17, probability data indicated a 98.2% chance of maintaining the current 3.50–3.75% rate, meaning the decision itself carries little informational weight. Instead, the dot plot and statements from policymakers, particularly Warsh, are crucial for market expectations.
If Warsh withholds his projection, it could lead to increased Treasury volatility, higher fear index values (VIX), and decreased liquidity across risk assets, negatively impacting Bitcoin amidst macro uncertainty.
Analysts suggest that reduced forward guidance from Warsh could heighten market volatility and put pressure on Bitcoin if projected rate hikes materialize. Warsh’s previous comments indicate that this meeting might mark a shift away from traditional forward guidance rather than a one-time event.
The longer-duration case runs in the opposite direction. Analysts at Galaxy Digital and Ark Invest have characterized Warsh’s elimination of the dot plot as something that effectively erodes the credibility of the traditional fiat transparency architecture, the “centrally planned” expectation-management apparatus.
TradingKey’s analysis has underpinned institutional confidence in dollar-denominated asset pricing since the post-2008 recovery. When that architecture becomes visibly less legible, Bitcoin’s transparent, algorithmically fixed supply schedule gains relative appeal precisely because it cannot be revised at a press conference.
The structural argument is not that Warsh’s policy is wrong; it is that any reduction in fiat-system predictability shifts the asymmetry. Every subsequent CPI print, payrolls report, or PCE release becomes a larger market event without a Fed roadmap to anchor interpretation.
That regime of higher macro sensitivity and greater ad hoc volatility in rate expectations is, historically, an environment in which rules-based scarce assets attract incremental defensive allocation.
The Two Paths for Bitcoin Post-FOMC
The most important press conference in finance happens today at 2:30pm ET.
Kevin Warsh. New Fed Chair. First meeting.
Everyone expects rates to hold at 3.50%.
But the rate decision is not the story.
The story is whether Warsh kills the dot plot today.
The confirmatory condition for the bullish path is a clean Warsh abstention, no dot submitted, neutral statement language, and a press conference that avoids hawkish rate-path signals.
In that scenario, near-term volatility is elevated but contained, and the structural Bitcoin narrative described by Galaxy Digital and Ark Invest begins accumulating as a medium-term positioning thesis.
The invalidating condition is a hawkish residual signal, whether via remaining participants’ dots clustering toward a 2027 first-cut timeline, explicit tightening-bias language in the statement, or a Warsh press conference that reads as restrictive.
Kitco warned that a hawkish dot configuration pushing cuts out to 2027 would lift real yields, support the dollar, and apply direct pressure on risk assets, including crypto.
We suspect the more likely near-term outcome is controlled ambiguity rather than clean hawkishness, but the outcome distribution is wide enough that on-chain capitulation dynamics from long-term holders could amplify any downside move in the event of a negative surprise.
Disclaimer: Coinspeaker is committed to providing unbiased and transparent reporting. This article aims to deliver accurate and timely information but should not be taken as financial or investment advice. Since market conditions can change rapidly, we encourage you to verify information on your own and consult with a professional before making any decisions based on this content.
Daniel Frances is a technical writer and Web3 educator specializing in macroeconomics and DeFi mechanics. A crypto native since 2017, Daniel leverages his background in on-chain analytics to author evidence-based reports and deep-dive guides. He holds certifications from The Blockchain Council, and is dedicated to providing "information gain" that cuts through market hype to find real-world blockchain utility.
In Strategy Bitcoin news today, the firm disclosed the sale of 32 BTC for approximately $2.5M in late May 2026, according to an SEC filing submitted on June 1. The transaction, representing less than 0.004% of the firm’s total holdings, was executed at prices consistent with tax-lot optimization rather than any shift in the company’s core corporate treasury posture.
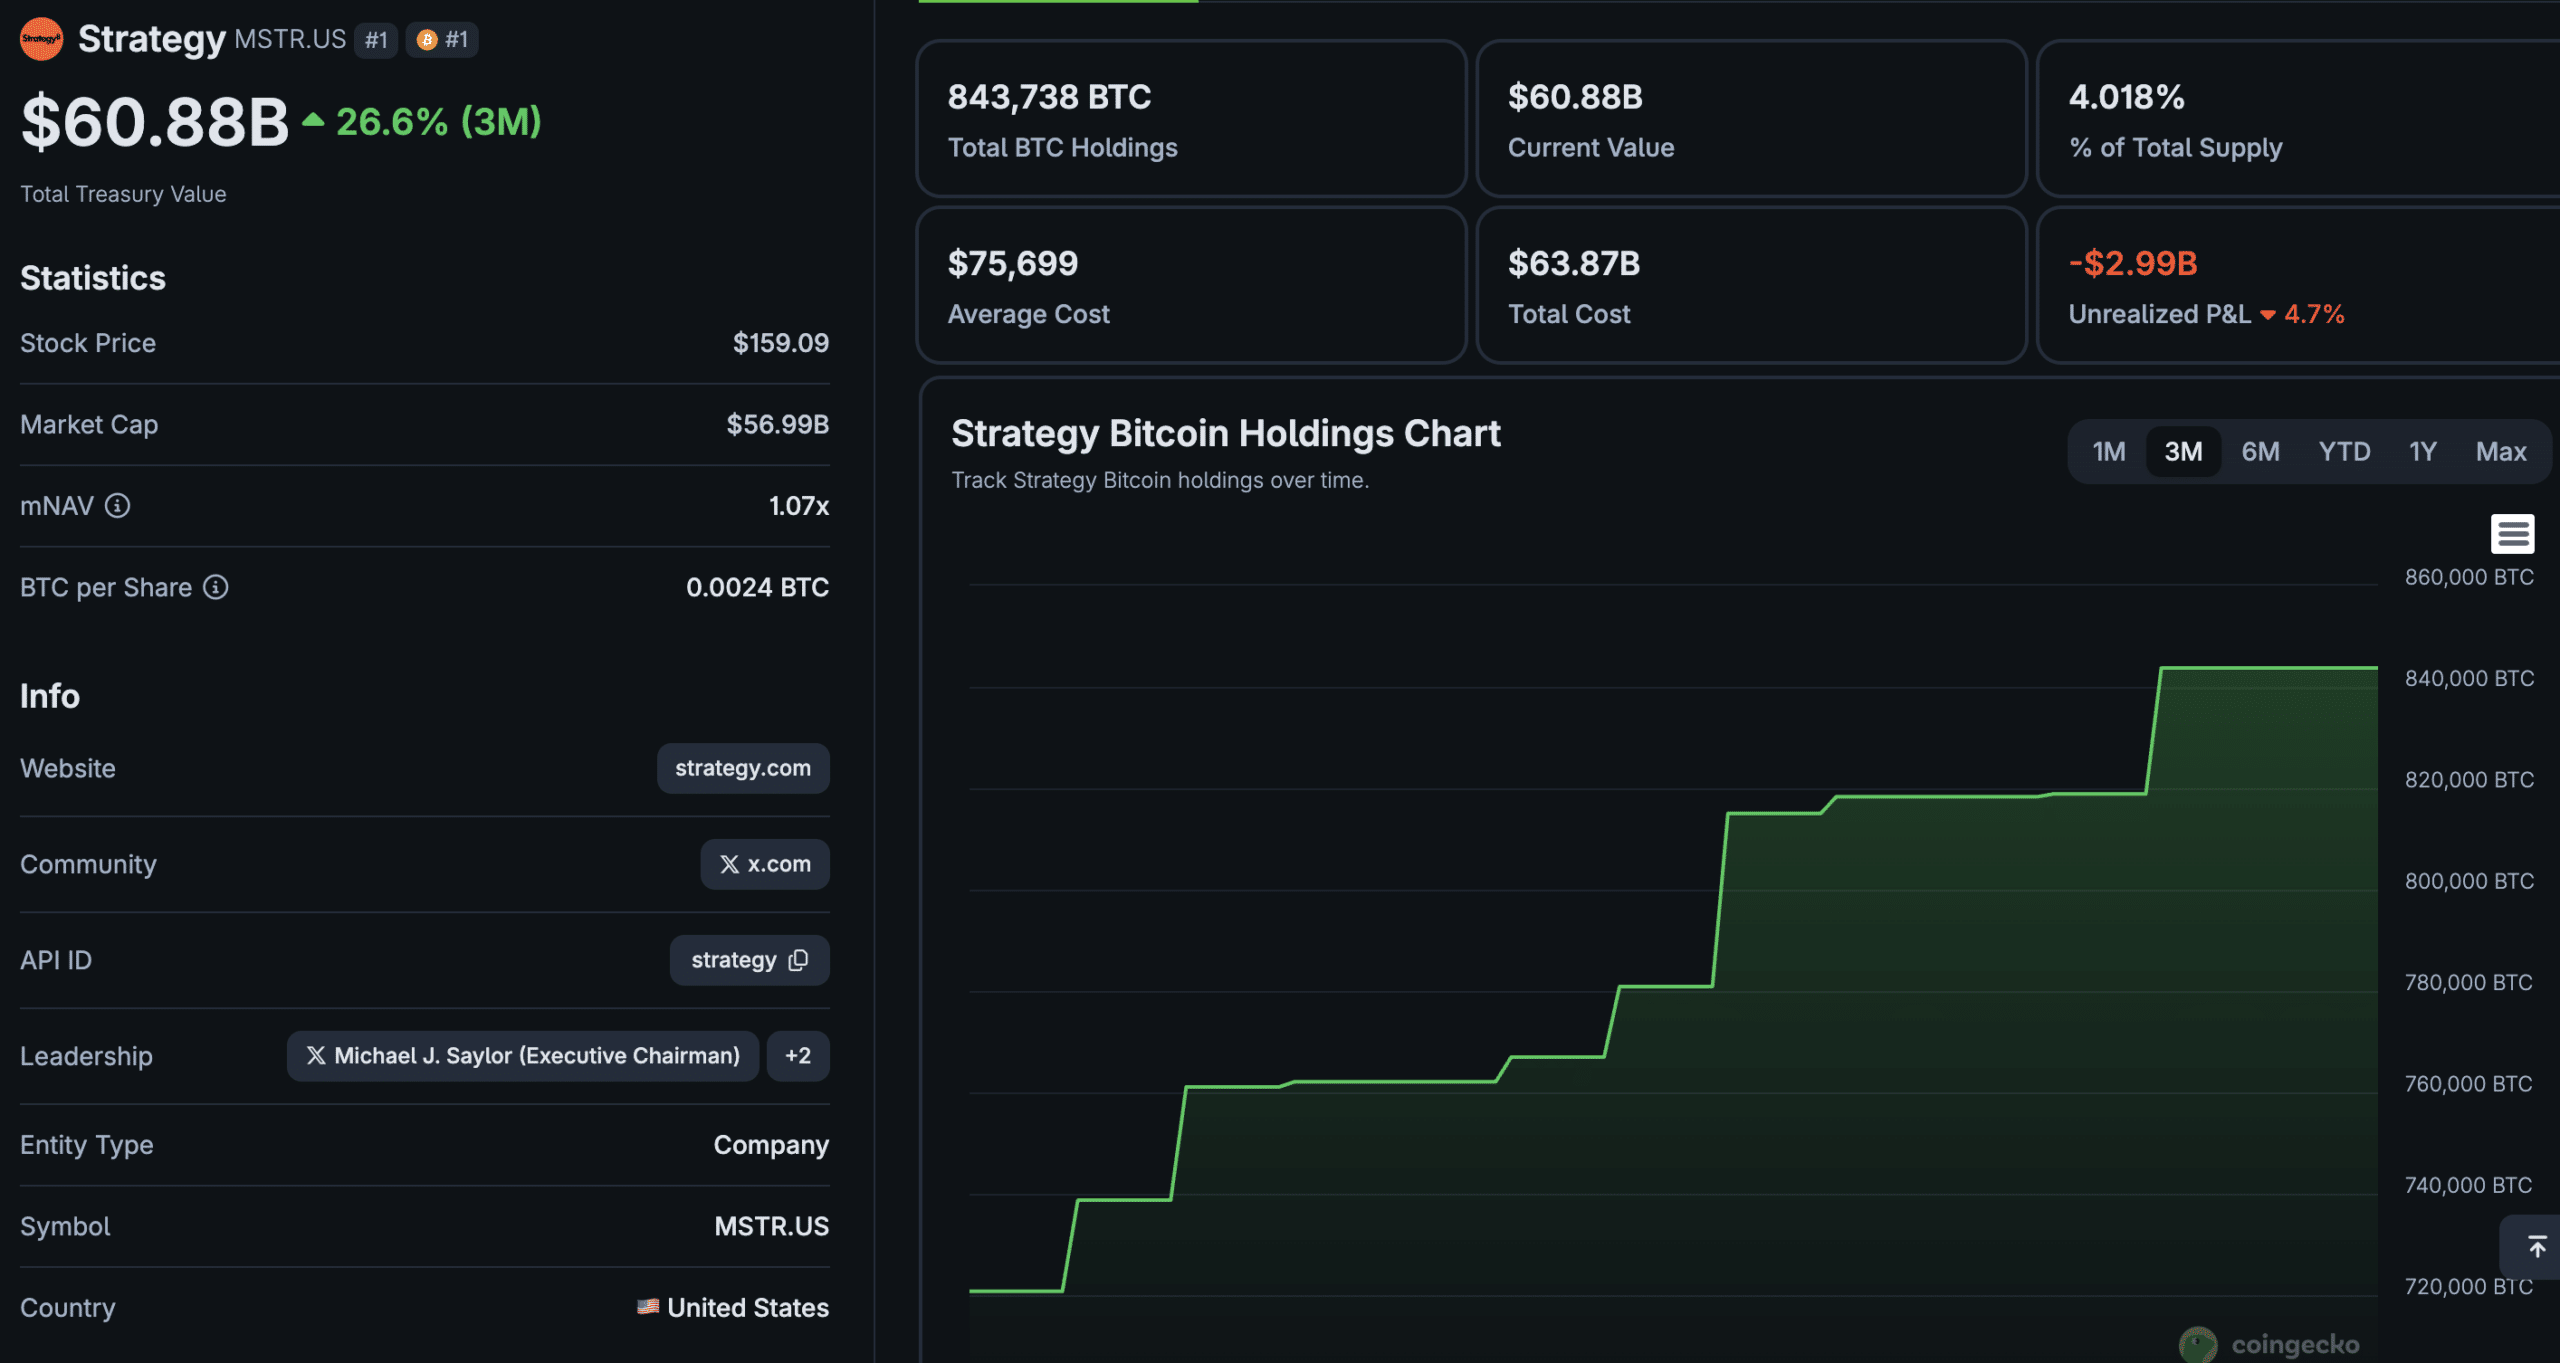
The analytical question is not whether Strategy sold Bitcoin; it did. The question is what a $2.5M disposal means relative to a balance sheet carrying more than 818,000 BTC, valued at roughly $61.8Bn, and whether it signals anything structurally new about how the firm manages its position.
This news dropped as Bitcoin crashed -2.5% overnight, losing $73,000 support, and is currently testing $72,000 as sell pressure continues to build across the market.
Strategy Bitcoin News: 32 BTC Sale and What the SEC Filing Actually Establishes
A recent filing confirms the sale of 32 BTC at nearly $2.5M during late May. It does not specify which tax lots were sold or if a buyback has occurred.
The strategy allows corporations to sell high-cost Bitcoin at a loss to offset taxable income without risking a wash-sale violation under current IRS cryptocurrency regulations. In December 2022, a similar strategy was executed, leading to a realized capital loss while increasing BTC holdings.
The late-May sale follows this pattern, as Bitcoin was trading around $78,000, allowing for tax-loss harvesting on lots purchased above that price. This transaction doesn’t change Strategy’s strong position on Bitcoin but offers an accounting benefit.
Additionally, the corporate alternative minimum tax on unrealized gains, which could start in 2026, might require periodic sales, and the 32 BTC sale may reflect that strategy, although this remains unconfirmed in the filing.
As of Q1 2026, Strategy held 818,334 BTC, acquired for about $51.8Bn at an average cost of roughly $75,353 per coin, representing around 4% of the total Bitcoin supply. The firm reported an estimated BTC yield of approximately 9% year-to-date, measured as Bitcoin accumulation per diluted share.
In early 2026, Strategy added about 3,376 BTC for around $255M in an April transaction, funded through share issuance. A January disclosure indicated purchases of 22,305 BTC from January 12 to 19, raising total holdings to 709,715 BTC at that time. Against this backdrop, a sale of 32 BTC is negligible.
During its Q1 2026 earnings call, management indicated a shift from a strictly hold-and-hope strategy to proactive BTC management to optimize Bitcoin per share, potentially selling up to 20 basis points of holdings to fund dividends and tax credits. The sale of 32 BTC reflects this new operational approach rather than a change in accumulation strategy.
Does the Tax Sale Signal a Policy Shift, or Routine Treasury Management?
Breaking: Strategy Sells Bitcoin for First Time Since 2022 Tax-Loss Trade
According to an 8-K filing with the SEC, Strategy sold 32 BTC between May 26 and May 31 for approximately $2.5 million, marking its first Bitcoin sale since it sold 704 BTC in December 2022 for tax-loss… pic.twitter.com/xrhRGfhy8w
Two interpretations are available. The first holds that this is straightforward tax engineering – a rounding-error disposal designed to optimize the firm’s tax position before a reporting period closes, with no implication for long-term conviction.
The 2022 precedent supports this reading: that transaction left Strategy with more Bitcoin than it started with and a useful capital-loss offset, and the current sale fits the same template.
The second interpretation treats the sale as an early data point in a gradual policy evolution, one in which regulatory pressure from CAMT, new mark-to-market accounting requirements under ASU 2023-08, and fiduciary obligations to preferred shareholders incrementally normalize small BTC disposals as a recurring treasury tool. Under this reading, the 32 BTC figure matters less than the precedent it represents.
The filing record and Strategy’s stated BTC-per-share framework resolve the tension in favor of the first interpretation. The firm’s capital-raising infrastructure – multiple at-the-market equity programs, convertible note facilities, and preferred share structures – remains oriented entirely toward net accumulation.
A 32 BTC sale executed within that architecture is a tax optimization, not a conviction signal. The structural conclusion is that the sale is consistent with responsible corporate treasury management and does not alter Strategy’s position as the dominant corporate holder of Bitcoin.
Disclaimer: Coinspeaker is committed to providing unbiased and transparent reporting. This article aims to deliver accurate and timely information but should not be taken as financial or investment advice. Since market conditions can change rapidly, we encourage you to verify information on your own and consult with a professional before making any decisions based on this content.
Daniel Frances is a technical writer and Web3 educator specializing in macroeconomics and DeFi mechanics. A crypto native since 2017, Daniel leverages his background in on-chain analytics to author evidence-based reports and deep-dive guides. He holds certifications from The Blockchain Council, and is dedicated to providing "information gain" that cuts through market hype to find real-world blockchain utility.
Long-term holders now control a record-high share of the Bitcoin circulating supply, a reading that, in any prior cycle, would have been straightforward evidence of mounting bullish pressure.
The complication, flagged in a May 29 report by on-chain analytics firm CryptoQuant, is that this supply concentration is coinciding with a near-complete stall in demand-side momentum, a configuration CryptoQuant describes as a buyer drought.
Bitcoin’s largest holders have stopped accumulating.
Dolphin balances have printed successive lower highs since Sept '25, while whale balances have remained flat since Feb '26.
Historically, when both cohorts stall simultaneously, sustained price weakness tends to follow. pic.twitter.com/YA5szi4BkO
High conviction among holders and the absence of incremental buyers are not mutually exclusive conditions, and right now, the market is living inside that paradox.
This news dropped as Bitcoin climbed a modest +0.5% overnight, barely holding above $73,000 after a -5.5% drop over the past seven days. Daily trading volume sits at $32.1Bn.
Record Bitcoin HODLing Without Fresh Demand is a Structural Problem, Not a Bullish Setup
The analytical question is no longer whether long-term holders are capitulating – they clearly are not. The question is whether record illiquidity in supply, absent a renewed wave of spot buying, serves as a floor or simply a ceiling on volatility, locking Bitcoin into a low-liquidity range where small sell orders have outsized price impact.
CryptoQuant’s on-chain data show that growth in new address creation has dropped to a multi-month low, while coin flows into accumulation addresses have decelerated sharply compared with the first quarter of 2026. The Realized Cap HODL Wave – which maps the age distribution of Bitcoin’s realized capitalization – is increasingly dominated by older, dormant coins, confirming that the freely tradeable float is structurally constrained. That is not, by itself, a catalyst.
CryptoQuant CEO Ki Young Ju has characterized the current environment as one where capital inflows have “entirely ceased” around the mid-$90,000 zone. Analyst Maartunn, writing for CryptoQuant, separately noted that 30-day retail demand growth is “deeply negative,” meaning neither large nor small cohorts are aggressively bidding at current levels. When whale exchange activity decreases during price recoveries – as the on-chain data currently shows – the recovery itself becomes suspect, driven by thin order books rather than genuine absorption of supply.
This matters structurally because high illiquid supply only translates into upside when accompanied by genuine spot buying. Without that, the market’s low float is less a coiled spring and more a quiet room – one where a sudden macro shift can produce sharp, asymmetric moves on relatively modest selling pressure. That kind of compression, historically, tends to precede something, not nothing.
Once profit-taking cascades, Bitcoin investors' PnL typically falls for about 18 months.
Since the trend turned in Oct 2025, the bear market could last until early 2027.
The trend only changes when unrealized profits rise and realized profits fall. We're not there yet. pic.twitter.com/fQyIRLu8vv
ETF Inflows Have Entered a Fatigue Phase and the Transmission Mechanism Is Weakening
ETF inflows from US spot Bitcoin products, the structural demand driver that redefined Bitcoin’s institutional ownership base through 2024, have shifted from a dominant buying force into a marginal one.
Daily net inflows tracked by SoSoValue have shifted from the billion-dollar range recorded during the ETF launch period to the low millions, with several sessions recording net outflows before stabilizing into mild re-accumulation.
BlackRock’s iShares Bitcoin Trust (IBIT) and Fidelity’s FBTC remain the category leaders by assets under management, but the novelty premium that drove early institutional allocation appears to have dissipated.
Goldman Sachs‘s and broader Wall Street’s participation in Bitcoin ETF products established a structural floor under the price, but floor-setting and marginal-bid provision are different functions. The former is in place; the latter has cooled.
The transmission mechanism matters here. When LTH supply is locked and ETF demand is the primary source of incremental buying, any ETF flow fatigue hits an illiquid market directly. Glassnode data from late 2025 documented exactly this dynamic: a period in which ETF net outflows briefly coincided with a sharp spot price dislocation before flows stabilized.
Observers watching the paradox of institutional momentum versus weak price action will recognize the current configuration as structurally similar. Capital rotation toward gold and silver has absorbed risk-off flows that might otherwise have entered Bitcoin, adding a competing-asset dimension to the demand shortfall.
Until the Crypto Clarity Bill advances materially in the US or Federal Reserve sentiment shifts in a way that re-energizes risk appetite, the ETF bid appears unlikely to re-accelerate on its own.
Disclaimer: Coinspeaker is committed to providing unbiased and transparent reporting. This article aims to deliver accurate and timely information but should not be taken as financial or investment advice. Since market conditions can change rapidly, we encourage you to verify information on your own and consult with a professional before making any decisions based on this content.
Neil is a professional cryptocurrency content writer with years of experience. He has written for various cryptocurrency websites to report on breaking news, and been hired by all sorts of cryptocurrency projects, to create content that would increase their exposure and attract more potential investors.
StarkWare chief product officer Avihu Levy has proposed a crypto scheme that he claims would render Bitcoin transactions quantum computing-safe today – without requiring a soft fork, a hard fork, or any modification to the existing protocol.
Published Thursday on GitHub, the Quantum Safe Bitcoin (QSB) proposal operates entirely within Bitcoin’s legacy script constraints and is designed to remain secure, Levy argues, even against an adversary running Shor’s algorithm on a large-scale quantum computer.
The catch is substantial: each transaction would cost the sender between $75 and $150 in GPU compute, making the scheme impractical for routine use and limiting its relevance, at least initially, to large-value transfers.
Hash-to-Sig Puzzle Mechanism: What the Proposed Bitcoin Quantum Scheme Actually Does
Bitcoin’s current signature scheme – the elliptic curve digital signature algorithm, or ECDSA – derives its security from the computational hardness of the elliptic curve discrete logarithm problem. That hardness does not hold against a sufficiently powerful quantum computer running Shor’s algorithm, which can solve the problem in polynomial time.
As recent research from Google Quantum AI has made increasingly concrete, the hardware threshold for executing such an attack may be closer than previously modeled – with estimates suggesting ECDLP-256 could be broken using roughly 500,000 physical qubits, a 20-fold compression from prior projections.
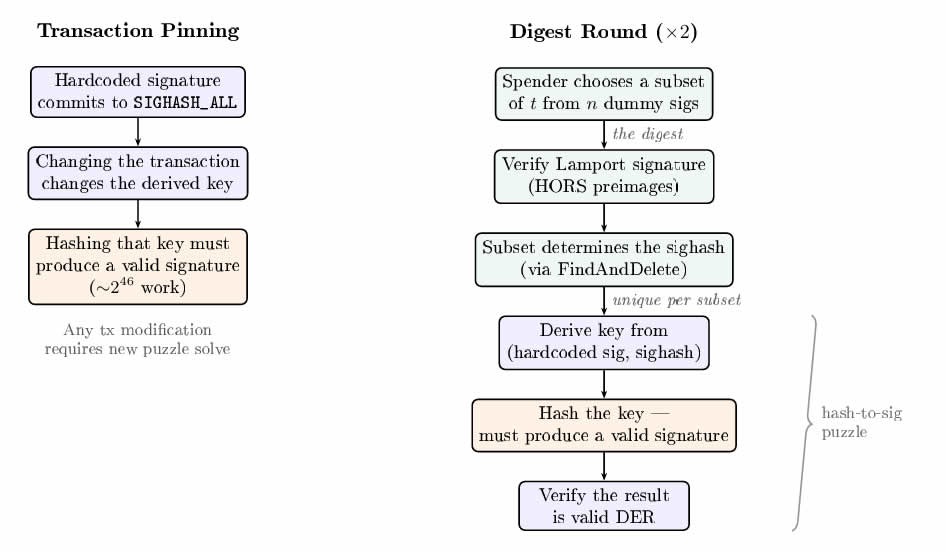
Levy’s proposal sidesteps ECDSA entirely by replacing the proof-of-work signature-size puzzle with what he terms a hash-to-sig puzzle.
Rather than proving knowledge of a private key through elliptic curve math, the spender must find an input whose hash output randomly resembles a valid ECDSA signature – a brute-force search task that offers no shortcut to quantum computing algorithms. The security model, in other words, shifts from a mathematical structure that Shor’s algorithm can exploit to hash preimage resistance, which it cannot.
Far more computing power is required for QSB. Source: GitHub
The key implication: QSB does not patch ECDSA – it replaces the cryptographic assumption underlying the spending condition, while leaving Bitcoin’s transaction format, consensus rules, and script engine untouched.
The QSB Proposal: Claims, Methodology, and What Remains Unverified
Levy’s proposal, which has not been peer-reviewed or formally published through an academic venue at time of writing, outlines a transaction construction that encodes the hash-to-sig puzzle within existing Bitcoin script primitives. No new opcodes are required.
No miner coordination is needed. From the network’s perspective, a QSB transaction is indistinguishable from a legacy transaction – it simply spends an output using a scriptSig that satisfies an unusually constructed scriptPubKey.
The computational burden falls entirely on the sender. Finding a hash preimage that mimics a valid ECDSA signature requires significant brute-force GPU work – Levy estimates $75 to $150 per transaction at current compute prices. That cost figures to be irrelevant for, say, a treasury-scale cold storage transfer; it is prohibitive for coffee. Levy acknowledges this directly, framing QSB as a stop-gap for large BTC positions while the community deliberates a longer-term protocol-level solution.
THIS IS HUGE. Bitcoin is Quantum-Safe TODAY.
Even if a quantum computer appeared, one that breaks the conventional Bitcion signatures, it shows a practical way to create safe Bitcoin transactions. WITH NO CHANGE TO BITCOIN PROTOCOL!!! https://t.co/ireGc3ai7W
— Eli Ben-Sasson | Starknet.io (@EliBenSasson) April 9, 2026
StarkWare CEO Eli Ben-Sasson characterized the proposal in stark terms on X, stating that it “essentially makes Bitcoin quantum-safe today.” That framing is doing significant argumentative work – the scheme makes specific large-value crypto transactions quantum computing resistant under its defined threat model, which is not equivalent to Bitcoin-the-network becoming quantum-safe in any comprehensive sense. The proposal has not been independently verified, and no Bitcoin Improvement Proposal has been filed to formalize or standardize the approach.
Disclaimer: Coinspeaker is committed to providing unbiased and transparent reporting. This article aims to deliver accurate and timely information but should not be taken as financial or investment advice. Since market conditions can change rapidly, we encourage you to verify information on your own and consult with a professional before making any decisions based on this content.
Daniel Frances is a technical writer and Web3 educator specializing in macroeconomics and DeFi mechanics. A crypto native since 2017, Daniel leverages his background in on-chain analytics to author evidence-based reports and deep-dive guides. He holds certifications from The Blockchain Council, and is dedicated to providing "information gain" that cuts through market hype to find real-world blockchain utility.
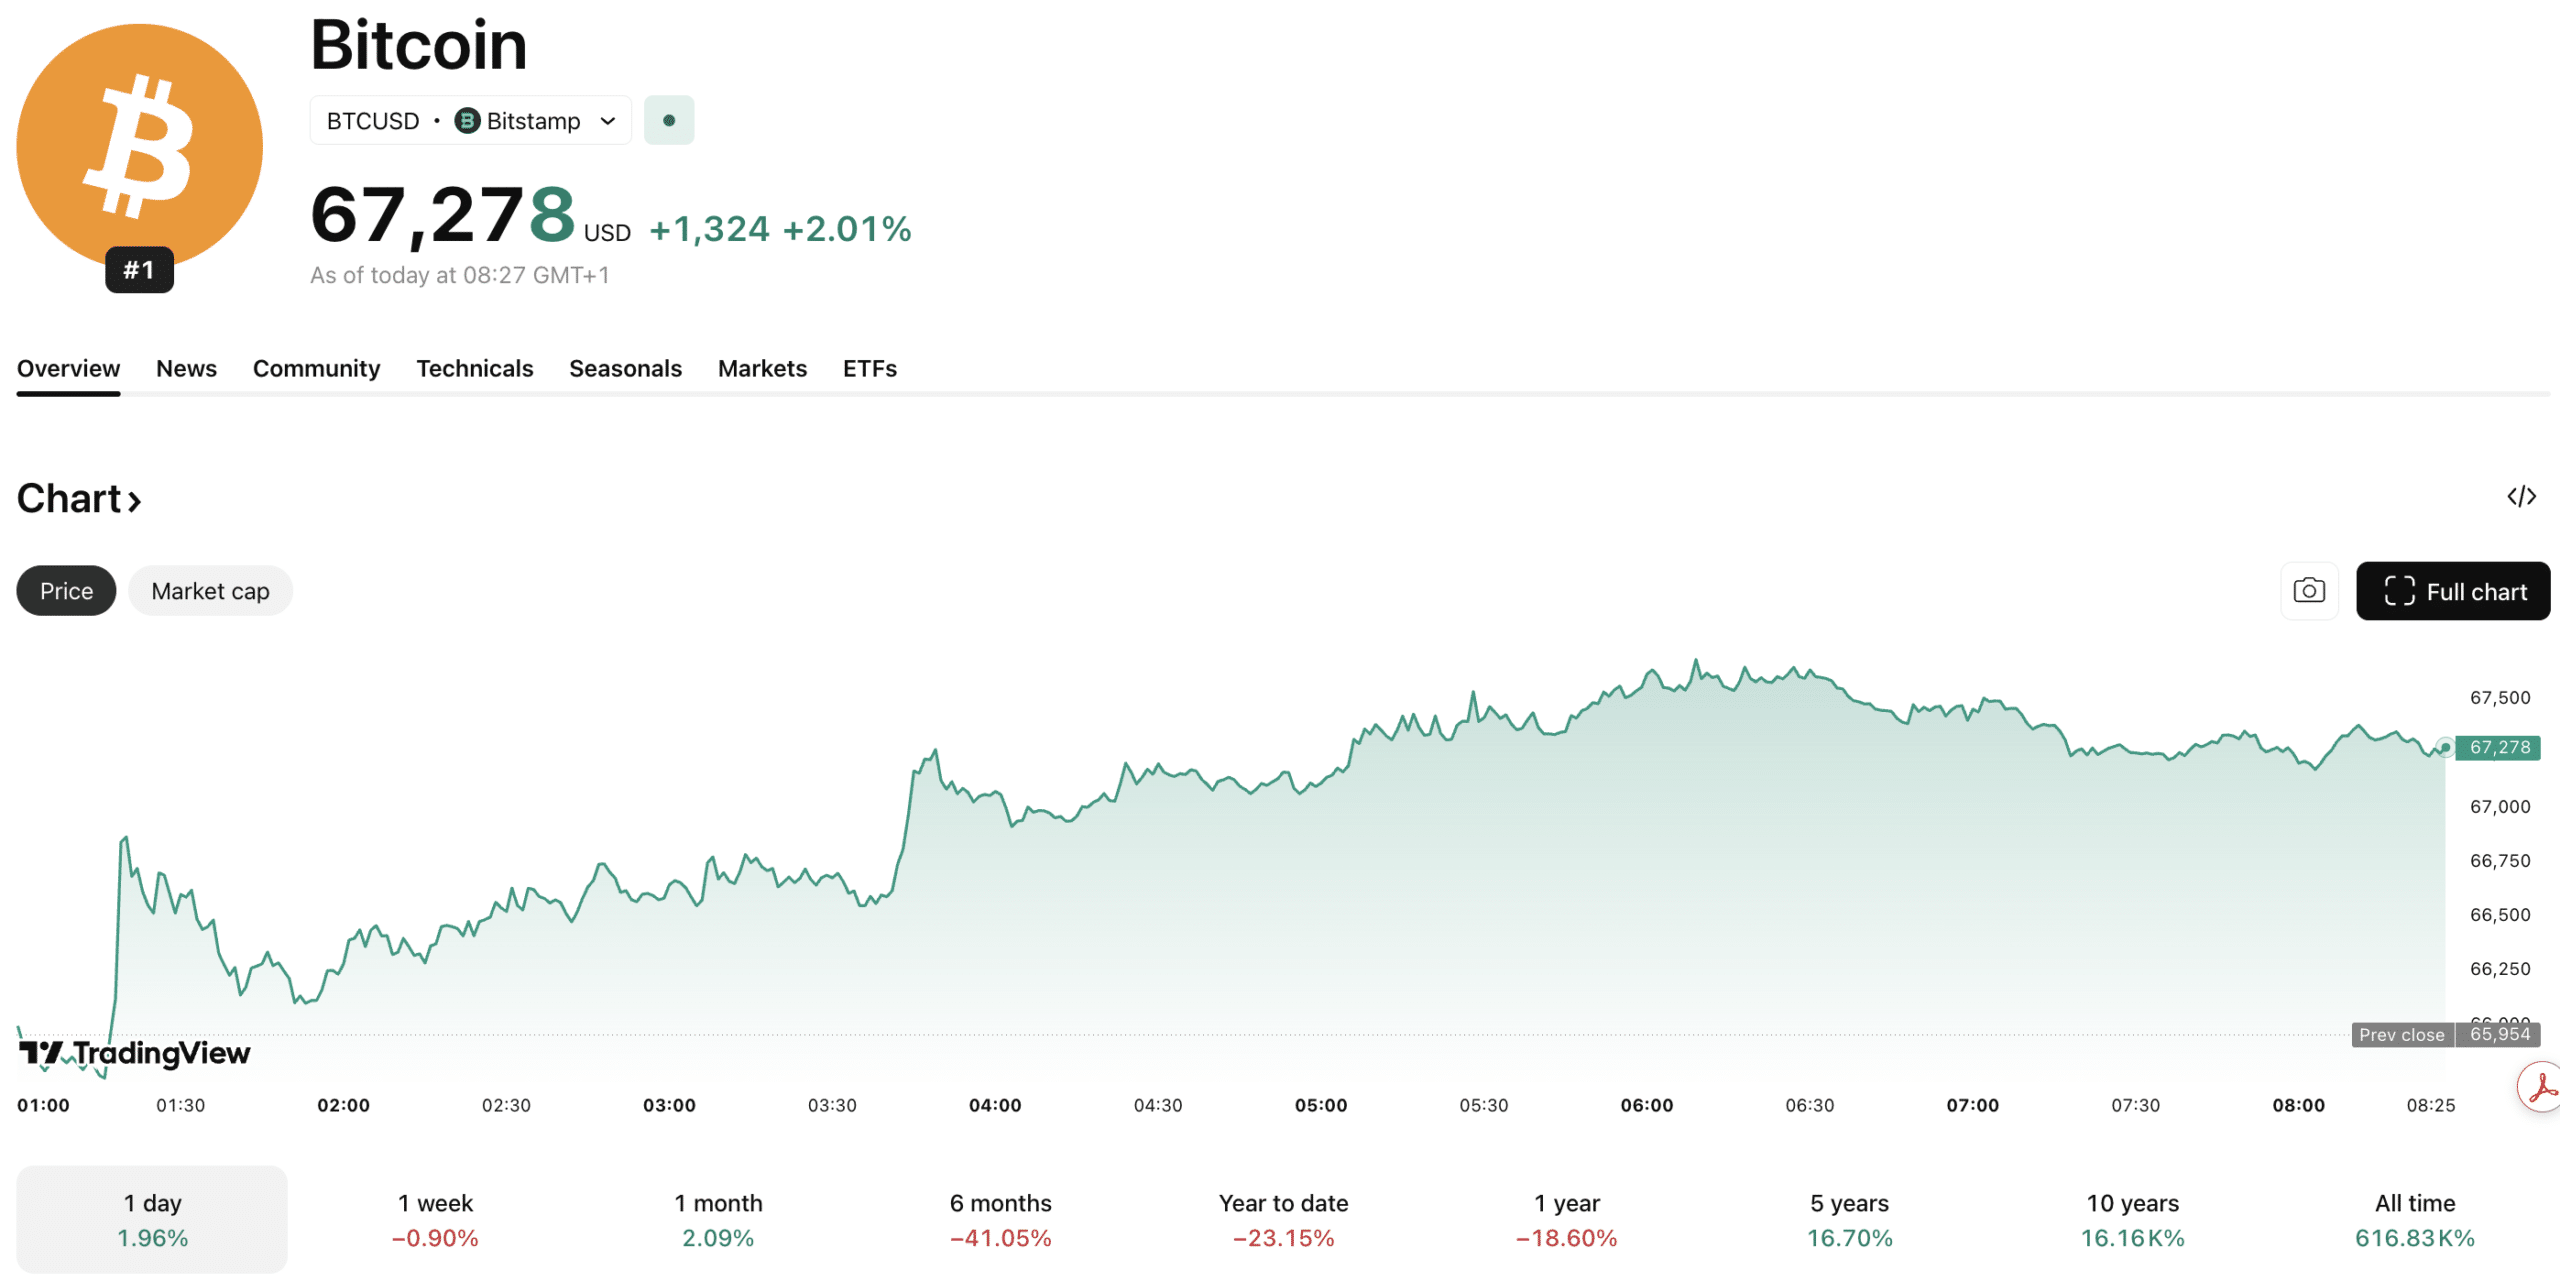
Bitcoin recovers to $69,000 with a 3.18% 24-hour gain as geopolitical risk drives BTC-gold correlation. Key support at $70,500, resistance at $72,500 — here’s what the charts say.
The Bitcoin price has climbed back over $67,000, posting a 24-hour gain of roughly +1% as geopolitical risk sends investors reaching for hard assets, both traditional and digital. The move mirrors gold’s own bid, a correlation that has sharpened considerably since the Middle East conflict entered its fifth week.
The catalyst this time was a simultaneous escalation on multiple fronts. Iran-backed Houthi forces opened a new front in the conflict, US ground troops arrived in the region, and The Wall Street Journal reported President Trump is weighing a military operation to remove enriched uranium from Iran, though no decision has been made.
Brent crude surged +2.5% to around $115 a barrel, now up roughly +-90% year-to-date, while Asian equities fell sharply, with Japan’s Nikkei dropping -3.4% and South Korea’s benchmark shedding -3.2%.
The broader crypto market followed, with the total market cap rising +1.2% and back over $2.4 trillion, while ETH USD recovered +2% to $2,044 and XRP added +1.5% to $1.35. BTC’s relationship with gold has become a recurring theme for macro analysts tracking safe-haven rotation this quarter.
BITCOIN IS COPYING GOLD'S CHART PERFECTLY.
And gold just exploded to new highs.
Long consolidation. Fake breakdowns. Sentiment destroyed. Then violent breakout.
Can Bitcoin Price Reclaim $72,000 Before Month-End?
The Bitcoin price sits in a technically significant zone. Trading volume reached $30Bn over the past 24 hours, down significantly from the end of last week, potentially signaling falling demand for BTC USD, even if the price remains range-bound.
Key technical levels are well-defined. Support clusters near $65,000–$65,500, with resistance capping at $68,500 and $69,200. The 24-hour range has been narrow (a consolidation pattern that historically precedes expansion), and multiple analysts flagged the BTC USD chart for a potential breakout at the close of March.
Three scenarios present themselves. Bull case: a volume spike breaks resistance at $68,500, opening a run toward prior highs. Base case: consolidation continues near $66,000–$68,000 pending a macro catalyst. The bear case and the invalidation level are clear: a sustained break below $65,000 would reopen the February lows.
At the current market cap, Bitcoin’s upside from $67,000 to $72,000 represents a roughly +8% move, meaningful, but modest for investors seeking asymmetric exposure to Bitcoin-ecosystem growth. That gap between spot BTC performance and early-stage opportunity is precisely where projects like Bitcoin Hyper ($HYPER) are positioning themselves.
As institutional Bitcoin demand grows, infrastructure capable of making BTC programmable and fast becomes increasingly relevant. Bitcoin Hyper claims to be the first Bitcoin Layer 2 integrating the Solana Virtual Machine, delivering, per the project, lower latency than Solana itself alongside a decentralized canonical bridge for BTC transfers and high-speed smart contract execution.
The presale has raised over $32M at a current token price of $0.0136778, with staking available at a high APY for early participants. Those are verifiable hard numbers, not projections, and are making HYPER one of the most in-demand crypto presales in 2026.
Disclaimer: Coinspeaker is committed to providing unbiased and transparent reporting. This article aims to deliver accurate and timely information but should not be taken as financial or investment advice. Since market conditions can change rapidly, we encourage you to verify information on your own and consult with a professional before making any decisions based on this content.
Daniel Frances is a technical writer and Web3 educator specializing in macroeconomics and DeFi mechanics. A crypto native since 2017, Daniel leverages his background in on-chain analytics to author evidence-based reports and deep-dive guides. He holds certifications from The Blockchain Council, and is dedicated to providing "information gain" that cuts through market hype to find real-world blockchain utility.
MicroStrategy (MSTR) has signaled an ambitious target to accumulate 1 million Bitcoin (BTC) by the end of 2026, a milestone that requires acquiring approximately 239,000 additional coins at an estimated cost of $22.2 billion. The Bitcoin treasury firm, led by Executive Chairman Michael Saylor, plans to finance this aggressive expansion through a combination of “Stretch” (STRC) perpetual preferred shares and at-the-market equity offerings, despite current holdings slipping below their cost basis amid recent market volatility.
“The Orange March Continues” — Michael Saylor, Executive Chairman of Strategy, hinting at continued accumulation via X (formerly Twitter).
MicroStrategy Accumulation Mechanics: The Path to 1 Million BTC
To achieve the 1 million coin target, Strategy must maintain a purchasing velocity of nearly $540 million per week through December 2026. Data from recent filings indicates the company currently holds 761,068 BTC, representing roughly 3.6% of the asset’s total fixed supply. The accumulation plan effectively removes these assets from the active trading float, transferring them into deep cold storage custody where they are excluded from daily market liquidity.
The cost of this acquisition strategy is rising. Strategy’s average cost basis now sits at approximately $75,696 per Bitcoin. With spot prices trading near $68,100, the company’s Bitcoin treasury is currently underwater by roughly 10%, marking a period of unrealized losses for the corporate giant. Despite this, Saylor’s recent social media activity suggests the firm views price dips as liquidity events allowing for high-volume execution without aggressive slippage.
Acquiring the remaining 238,932 BTC needed to hit the seven-figure mark will require capital issuance on a scale rarely seen for a single asset class. Previous purchase milestones utilized convertible debt notes; however, the scale of the 2026 target has necessitated a shift toward more complex equity instruments.
Financing Structure: The ‘Digital Credit’ Innovation
Strategy has pivoted its funding model to rely heavily on “Stretch” (STRC) perpetual preferred shares, a financial instrument described by analysts as “digital credit.” distinctive for its high yield. These shares carry an 11.5% annual dividend, committing the company to pay investors approximately $0.09 annually for every dollar raise. This structure allows Strategy to raise recurring capital without immediately diluting MSTR common shares to the same extent as a direct equity offering.
The mechanics involve ring-fencing proceeds specifically for Bitcoin acquisition, utilizing a $2.25 billion reserve to service the dividend obligations. This approach theoretically allows the firm to arbitrage the difference between the 11.5% cost of capital and Bitcoin’s annualized appreciation. However, the model faces headwinds; the company reportedly halted STRC funding last week after facing difficulties raising fresh capital through the instrument, highlighting the market’s sensitivity to yield sustainability.
Market observers note that while convertible notes pose a risk of maturing debt, preferred shares create a perpetual dividend obligation that weighs on cash flow. The sustainability of the 1 million BTC plan depends heavily on the firm’s ability to refinance these obligations or cover them through the appreciation of the underlying asset.
1 million Bitcoin inside a single corporate entity changes the market structure permanently.
That holding represents 4.76% of the total 21 million supply. Adjust for lost coins and the percentage of actual circulating supply is significantly higher. Strategy has historically bought through corrections without flinching, which analysts say creates a structural supply floor beneath the market.
Bitcoin (BTC)
24h7d30d1yAll time
This is different from ETF inflows. ETFs depend on retail and advisor demand. Strategy buys on executive mandate. That means the firm can absorb sell-side pressure during periods of market apathy when nobody else is stepping in.
The whole machine runs on the MSTR premium. Shares trade above the Net Asset Value of the Bitcoin on the balance sheet, which lets the company issue equity at a high valuation and buy Bitcoin at market price. Sell high, buy lower. The gap is the edge.
But that edge is under pressure. Bitcoin dropped 3.8% over the weekend and Strategy’s position slipped into the red. A contracting NAV premium shrinks the capacity to raise funds through ATM offerings. The infinite money glitch only works while the premium holds.
There is another wrinkle. While the corporation is accumulating aggressively, Saylor has been selling his personal holdings. Corporate conviction and executive profit-taking moving in opposite directions is a detail the market is not ignoring.
The next 8-K filing tells the real story. Either the STRC funding pause is temporary and the march to 1 million BTC continues, or something structural has shifted in how Strategy plans to fund the final leg.
Disclaimer: Coinspeaker is committed to providing unbiased and transparent reporting. This article aims to deliver accurate and timely information but should not be taken as financial or investment advice. Since market conditions can change rapidly, we encourage you to verify information on your own and consult with a professional before making any decisions based on this content.
Neil is a professional cryptocurrency content writer with years of experience. He has written for various cryptocurrency websites to report on breaking news, and been hired by all sorts of cryptocurrency projects, to create content that would increase their exposure and attract more potential investors.
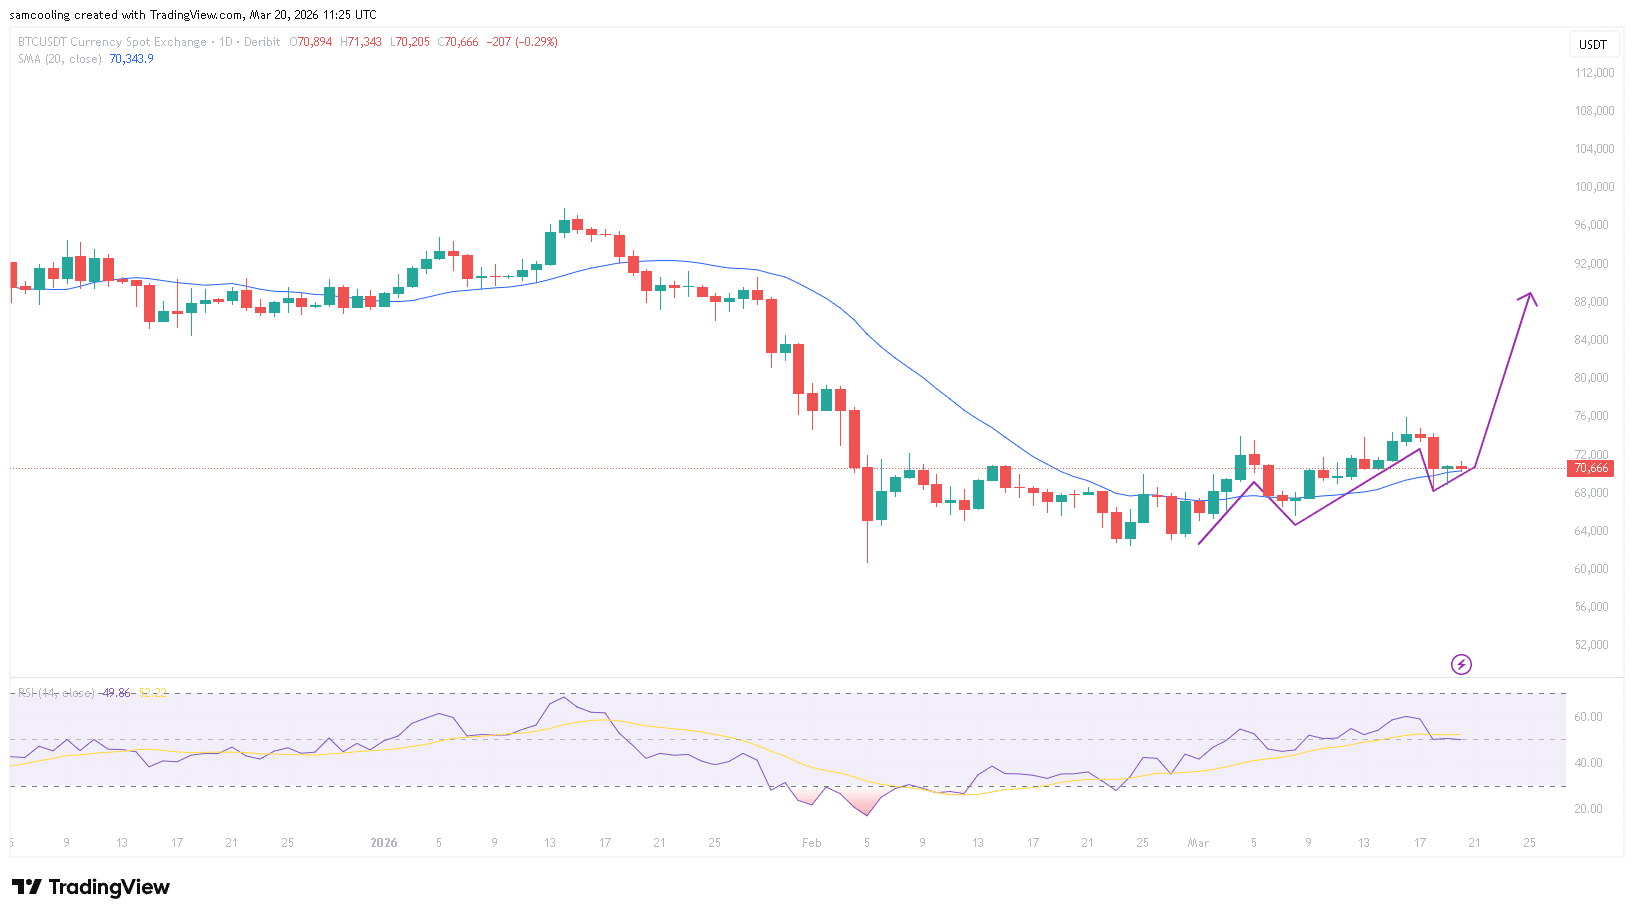
Bitcoin struggles to hold $70,000 as geopolitical tension regarding Iran outweighs regulatory wins. Analysis of BTC price targets and new Layer 2 infrastructure.
Bitcoin price is struggling to hold the psychological $70,000 threshold as geopolitical tensions involving Iran exacerbate global inflation fears, effectively overshadowing a significant regulatory victory for cryptocurrencies in the US earlier this week. The asset has retraced for three consecutive days—falling from a six-week peak of nearly $76,000 on Tuesday, signaling that macro headwinds are currently dictating market liquidity.
Trading data from late trading hours in Singapore places the token at around $70,500, showing little net change week-over-week despite the intra-week volatility. While fears of an oil price frenzy traditional equities, digital assets are not proving immune to the risk-off sentiment. High selling pressure has been observed across major exchanges, with 24-hour volumes spiking as traders de-risk portfolios ahead of the weekend.
Can Bitcoin Price Defend the $70,000 Support Level?
The immediate technical outlook suggests a precarious consolidation. As of March 20, Bitcoin (BTC) is trading down approximately 4.30% over the last 24 hours, testing lows near the $72,000 equivalent (IDR 1.20 billion) according to regional data from Bittime. The price action is currently confined within a descending channel, with the asset slipping below key moving averages that had previously supported the rally to $76,000.
If the $70,000 support fails to hold, where is the floor? Prediction markets are pricing in localized pessimism. Data from Robinhood’s derivatives desk shows betting clusters forming around the $60,600 to $60,800 range for late March settlements, implying that a break below current supports could trigger a cascade of liquidations. Conversely, a rebound would need to clear overhead resistance at $73,500 to invalidate the short-term bearish structure. Analysts note that while the threat to the $70k support level is real, broader institutional flows remain stickier than retail sentiment suggests.
While the legacy Bitcoin asset chops within established ranges, capital often rotates into early-stage infrastructure plays that promise to solve the network’s underlying utility constraints. The logic is simple: volatility is temporary, but scalability issues are permanent without technological intervention. This rotation is evident in the traction surrounding Bitcoin Hyper (HYPER), a new protocol designed to address Bitcoin’s lack of programmability.
Bitcoin Hyper positions itself as the first-ever Bitcoin Layer 2 to integrate the Solana Virtual Machine (SVM). By leveraging SVM, the project claims to deliver sub-second finality and smart contract capabilities that the base Bitcoin layer cannot support natively. The data indicates the market is receptive to this narrative; the project has raised exactly $32,033,734.37 to date, with the current presale stage pricing the token at $0.0136773.
The protocol aims to bridge the gap between Bitcoin’s security and the execution speed required for modern DeFi applications. For investors weathering the current macro storm, high-yield staking options within the ecosystem offer a potential hedge against price stagnation. However, users should note that Layer 2 solutions carry smart contract risks distinct from holding the underlying asset. Those interested in the technical specifics can check the Bitcoin Hyper price and features here.
Disclaimer: Coinspeaker is committed to providing unbiased and transparent reporting. This article aims to deliver accurate and timely information but should not be taken as financial or investment advice. Since market conditions can change rapidly, we encourage you to verify information on your own and consult with a professional before making any decisions based on this content.
Daniel Frances is a technical writer and Web3 educator specializing in macroeconomics and DeFi mechanics. A crypto native since 2017, Daniel leverages his background in on-chain analytics to author evidence-based reports and deep-dive guides. He holds certifications from The Blockchain Council, and is dedicated to providing "information gain" that cuts through market hype to find real-world blockchain utility.
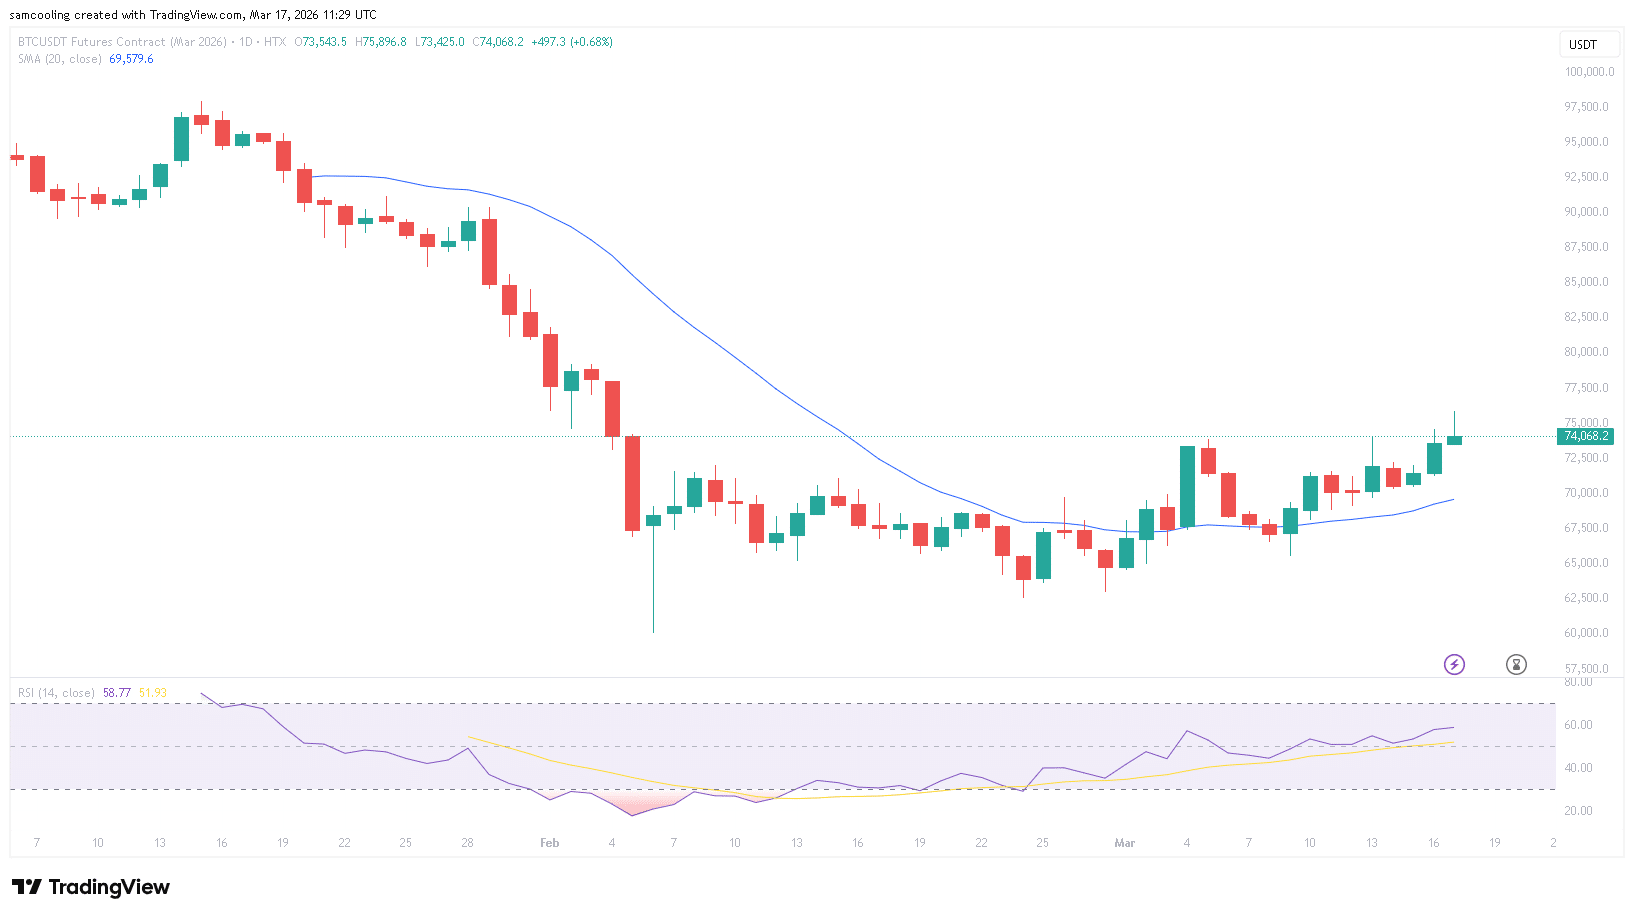
Bitcoin (BTC) is trading near $73,900, consolidating below the psychological $75,000 threshold as the executive branch intensifies public pressure on the Federal Reserve. The catalyst is President Donald Trump’s demand for an immediate “special meeting” to slash interest rates, a political challenge to central bank independence that is forcing markets to reprice the probability of premature liquidity expansion ahead of the March FOMC.
While the Federal Reserve has maintained a restrictive stance to combat sticky inflation, the President’s insistence that cuts occur “right now” introduces volatility into risk assets. Markets are currently weighing the likelihood of the Fed capitulating to executive pressure against the backdrop of steady economic data, a dynamic that directly impacts the cost of capital and, by extension, the net liquidity available for speculative assets like crypto.
President Trump’s recent comments, delivered at a White House meeting and amplified on social media, explicitly target Fed Chair Jerome Powell’s data-dependent approach. Trump argued that a “third-grade student” would understand the need for cuts, framing the current 3.50% to 3.75% target range as a national security threat. For crypto markets, the mechanism of action here is the implied cost of leverage. Trump’s push for lower rates aims to reduce debt-service costs on the $39 trillion national debt, but it also signals a potential shift toward fiscal dominance, a scenario in which monetary policy is forced to accommodate government spending.
Despite the political rhetoric, the data does not yet support an immediate pivot. The CME FedWatch Tool currently indicates a 99% probability that rates will remain unchanged at this week’s FOMC meeting. The probability for the subsequent April 29 meeting is similar at 97% for a hold. This disconnect between the President’s demands and market pricing creates a binary risk environment: if the Fed holds firm as expected, liquidity remains tight; however, any dovish signal from Powell would likely be interpreted as a capitulation, triggering a rapid repricing of the dollar and a surge in risk assets.
The tension is further complicated by the fiscal landscape. With the proposed “One Big Beautiful Bill Act” projecting massive injections into the economy, inflation risks remain elevated at 2.4%. Bankrate economist Michael Nguyen notes that such injections typically spur GDP growth but simultaneously drive inflation higher. Should the Fed cut rates prematurely into this fiscal stimulus, real rates could turn deeply negative—a historically bullish condition for hard assets like Bitcoin.
Bitcoin’s price action currently reflects its status as a high-beta proxy for global liquidity rather than a pure safe-haven asset. The 30-day correlation between BTC and the Nasdaq 100 remains tight, suggesting that crypto markets are trading primarily on the discount rate mechanism. If Trump’s pressure campaign succeeds in forcing yields lower, the resulting liquidity expansion would disproportionately benefit growth-sensitive assets.
However, a decoupling scenario exists. If the bond market interprets a potential rate cut as a policy error that will reignite inflation, the 10-year Treasury yield could spike in anticipation of long-term devaluation. In this environment, some analysts argue Bitcoin could diverge from equities, behaving more like digital gold amid sovereign debt concerns. Currently, however, the primary driver remains the immediate cost of money, with Bitcoin reacting sharply to any shifts in the federal funds futures curve.
To the upside, the critical resistance level remains $72,000. Reclaiming this level on spot volume would confirm a breakout from the current accumulation phase. Technical indicators suggest neutrality, with the RSI hovering near 50, indicating the market is waiting for a definitive macro trigger—likely the FOMC’s statement or dot plot update—to choose a direction.
Institutional flows appear to be pausing in anticipation of the Fed’s next move. While spot Bitcoin ETFs, including BlackRock’s IBIT and Fidelity’s FBTC, have seen consistent inflows year to date, the pace has decelerated as Treasury yields remain elevated. Institutional allocators are essentially earning a risk-free 3.5% to 4% in short-term government paper, raising the opportunity cost of holding non-yielding assets like Bitcoin.
Analytics firm Glassnode data indicates that long-term holder supply remains resilient, suggesting that conviction buyers are ignoring the short-term political noise. However, for a sustained move higher, the market requires net new capital inflows, which are historically correlated with periods of monetary easing. If the Fed signals that it will ignore executive pressure and maintain a “higher for longer” stance, we could see a temporary rotation of capital out of risk assets and back into fixed income.
Until the Federal Reserve clarifies its stance vis-à-vis the administration’s pressure, the probability of range-bound volatility remains elevated, effectively capping Bitcoin’s immediate upside near resistance levels.
Disclaimer: Coinspeaker is committed to providing unbiased and transparent reporting. This article aims to deliver accurate and timely information but should not be taken as financial or investment advice. Since market conditions can change rapidly, we encourage you to verify information on your own and consult with a professional before making any decisions based on this content.
Daniel Frances is a technical writer and Web3 educator specializing in macroeconomics and DeFi mechanics. A crypto native since 2017, Daniel leverages his background in on-chain analytics to author evidence-based reports and deep-dive guides. He holds certifications from The Blockchain Council, and is dedicated to providing "information gain" that cuts through market hype to find real-world blockchain utility.
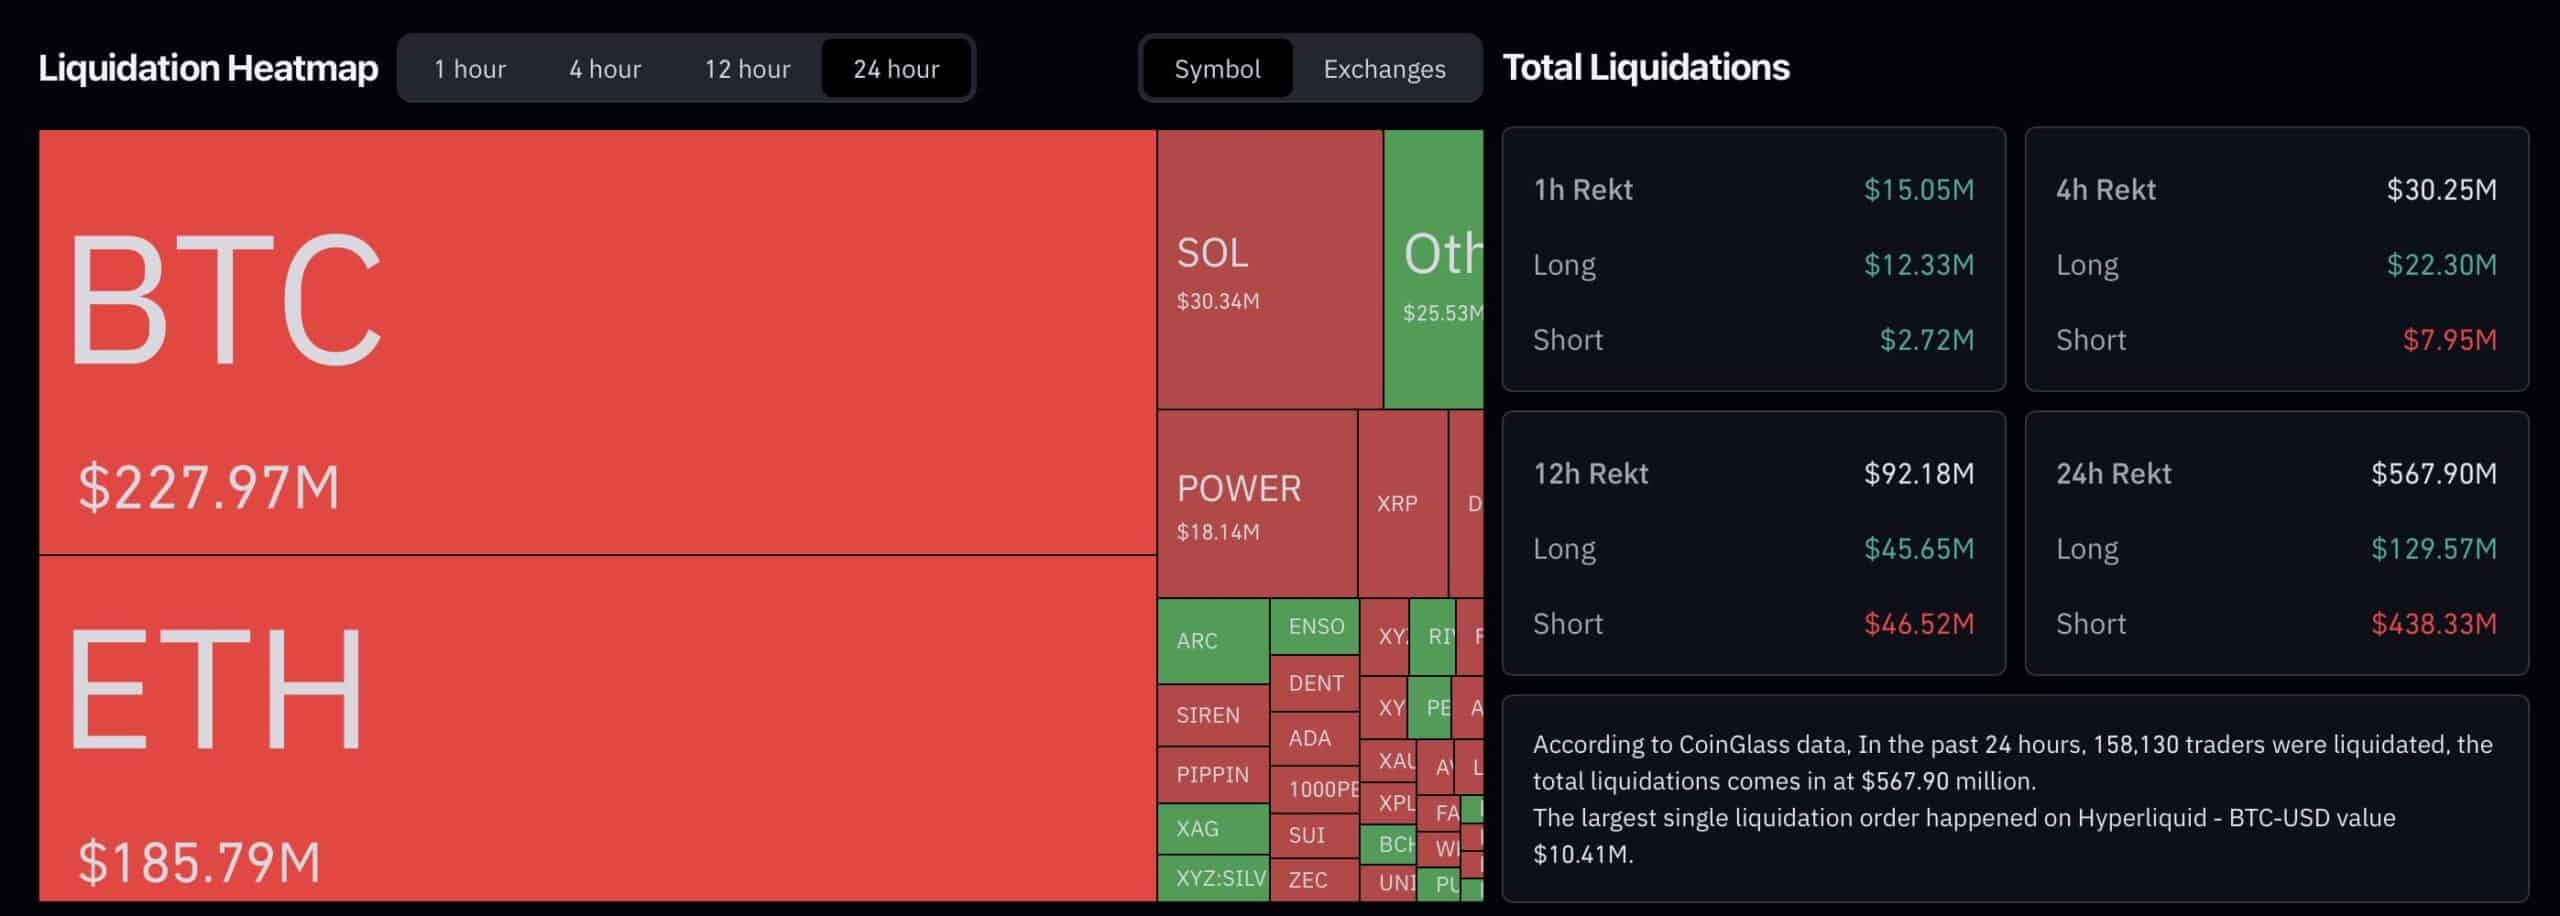
BTC USD price rebounded over 7% to touch an intraday high of $69,487 on Thursday, driven by a cascade of short liquidations and renewed risk-on sentiment following Nvidia Corp.’s blockbuster earnings report. The strong reversal comes just 48 hours after BTC dipped below $63,000, creating a volatile environment that has wiped out over half a billion dollars in leveraged positions.
$NVDA just had its biggest Q/Q revenue growth in history and it says that data center revenue is now up 13x since ChatGPT was released pic.twitter.com/6H3DNh0jEJ
The swift recovery to the $68,000 level signals a potential shift in market structure, as the leading cryptocurrency closely tracks surging tech stocks. Analysts suggest the move has cleared significant bearish leverage, potentially opening the path for a sustained BTC breakout toward the psychological $70,000 barrier.
The sudden crypto market rally caught highly leveraged bearish traders off guard, triggering a massive liquidity flush. As prices rose, short sellers were forced to buy back assets to cover their losing positions, creating a feedback loop known as a short squeeze. Approximately $576 million worth of futures positions were liquidated across the market within 24 hours.
Of this total, roughly $470 million stemmed from short positions, with Bitcoin-specific derivatives accounting for $227 million of the carnage. The magnitude of these short liquidations suggests that traders had aggressively positioned for further downside following the earlier dip to $62,000.
While derivatives mechanics fueled the velocity of the move, the primary macro catalyst appears to be the ‘wealth effect’ spilling over from traditional equity markets. Nvidia Corp. (NVDA), largely viewed as the bellwether for the global AI trade, reported record-breaking earnings for Q4 of Fiscal Year 2026. The chipmaker posted quarterly revenue of $68 billion, a 73% year-over-year increase, calming investor fears regarding the sustainability of AI infrastructure spending.
The report lifted the Nasdaq 100 by 351 points and the S&P 500 by 56 points, reigniting a risk-on environment that historically benefits Bitcoin price action. With Bitcoin frequently serving as a liquidity proxy for global tech sentiment, the correlation remains a critical factor for short-term traders.
Nvidia’s performance has seemingly validated the broader tech structural thesis. As noted in recent market analysis, the company’s results acted as a barometer for the AI-fueled trade, restoring confidence in capital allocation across the tech sector and indirectly supporting risk assets like cryptocurrencies.
Bitcoin Technical Analysis: Can BTC USD Price Sustain $70K?
From a technical perspective, the reclaim of $68,000 is a significant development. The asset has established a higher low structure following the defense of the $60,000 support zone, a level that technical analysts have flagged as critical for the long-term bull trend. By holding above $68,000, Bitcoin is now testing the upper bounds of its multi-week consolidation range.
Momentum indicators are also recovering from oversold conditions. Just days ago, BTC USD price metrics suggested an exhausted sell-side, with some oscillators flashing deep value signals. As noted in previous analysis, when Bitcoin RSI hits deep value levels, it often precedes a mean reversion, which appears to be materializing in the current session.
The immediate resistance now lies between $69,500 and $70,000. A daily close above this zone would confirm a BTC breakout, invalidating the bearish thesis of a lower-high formation. Conversely, failure to hold $68,000 could see the price retest the liquidity grab around $65,000.
BTC USD Rebounds Toward $70,000 on Nvidia Earnings Boost, Lifting Layer 2 Presales Like Bitcoin Hyper
Finally Bitcoin staged a strong recovery, surging over 7% after dipping below $63,000 earlier in the week. The rally cleared heavy bearish leverage and signaled a potential shift in structure. BTC USD now hovers around $67,000–$68,500, testing the psychological $70,000 barrier. Breaking above this level could provide some relief to bulls towards the end of February 2026.
The primary catalyst stemmed from Nvidia’s blockbuster Q4 FY2026 earnings report released February 25, posting record revenue of $68.1 billion (up 73% year-over-year) and adjusted EPS of $1.62, beating estimates. Data center revenue hit $62.3 billion (up 75%), reinforcing confidence in sustained AI infrastructure demand. This lifted tech indices and spilled over into crypto, where Bitcoin often acts as a high-beta proxy trade.
Benefitting from this renewed hype in the market are plays like Bitcoin Hyper (HYPER). HYPER is advancing as a pioneering Bitcoin Layer 2 solution, integrating Solana Virtual Machine (SVM) for high-throughput scalability while preserving Bitcoin’s security. The project enables rapid, low-cost BTC transactions, staking with up to 37% APY rewards, DeFi tools like DEXs, and on-chain dApps for payments, meme coins, and NFTs.
It uses rollups (optimistic and ZK) and sidechains to batch transactions, with a canonical bridge for trustless BTC deposits/withdrawals: verifying via SVM smart contracts and settling on Bitcoin L1.
The HYPER has raised over $31 million, with tokens at $0.0136762 in the current stage and planned increases ahead. Exchange listings are eyed for 2026.
As Nvidia’s results validate tech growth and Bitcoin clears bearish overhang, Layer 2 innovations like Bitcoin Hyper offer early exposure to enhanced Bitcoin utility before broader adoption.
Disclaimer: Coinspeaker is committed to providing unbiased and transparent reporting. This article aims to deliver accurate and timely information but should not be taken as financial or investment advice. Since market conditions can change rapidly, we encourage you to verify information on your own and consult with a professional before making any decisions based on this content.
Daniel Frances is a technical writer and Web3 educator specializing in macroeconomics and DeFi mechanics. A crypto native since 2017, Daniel leverages his background in on-chain analytics to author evidence-based reports and deep-dive guides. He holds certifications from The Blockchain Council, and is dedicated to providing "information gain" that cuts through market hype to find real-world blockchain utility.
Michael Saylor, chairman of the Bitcoin treasury firm Strategy, has signaled the company’s impending 100th Bitcoin purchase, marking a significant operational milestone in an accumulation campaign that began in August 2020.
The firm currently holds 717,131 BTC according to official stats and has executed purchases for 12 consecutive weeks, continuing its aggressive acquisition strategy despite recent market volatility.
On Saturday, Saylor suggested the transaction was imminent by sharing portfolio tracking data on X, a communication method he frequently employs prior to filing official acquisition disclosures with the Securities and Exchange Commission.
In his social media post, Saylor shared a screenshot captioned “The Orange Century,” alluding to the 100th transaction count.
According to firm data, Strategy has completed 99 distinct Bitcoin acquisitions to date.
Since its initial $250 million capital allocation nearly six years ago, the company has transformed its corporate structure to become the world’s largest public holder of the digital asset.
The journey to this milestone has not been without significant volatility. Recent market movements have placed pressure on the firm’s balance sheet.
While Strategy reports $12.4B Bitcoin loss Q4 2025 highlighted the risks associated with mark-to-market accounting during drawdowns, the company has maintained its “accretion” strategy without deviation.
The firm aims to increase the amount of Bitcoin per share, prioritizing this metric over short-term fiat valuations.
First time I’ve seen Saylor look nervous speaking publicly.
He can’t say anything else, but deep down he knows extreme downside scenarios aren’t impossible.$BTCpic.twitter.com/PS3NDZhYao
The impending 100th purchase comes as Strategy navigates a challenging price environment. Official data indicates the firm’s average cost basis currently stands at approximately $76,027 per Bitcoin.
With the asset trading below this threshold in recent weeks, the treasury is technically in an unrealized loss position, reminiscent of the crypto winter of 2022.
Despite the price action, the firm has utilized capital raised through convertible debt and preferred stock to expand its holdings, recently acquiring over 2,400 BTC in mid-February 2026.
This unwavering commitment mirrors the approach of other corporate adopters. For instance, the resolve seen as Metaplanet to continue Bitcoin buying despite the crash illustrates a similar high-conviction thesis among corporate treasuries in Asia.
Strategy’s issuance of preferred stock and debt to fund these purchases has effectively leveraged its position, though it introduces risks related to interest obligations.
JUST IN: 🇺🇸 Eric Trump says Bitcoin will reach $1 million.
Market Implications of Continued Institutional Demand
Strategy’s persistence signals its strong conviction that volatility is an accumulation opportunity rather than a distress signal.
The corporate sector is increasingly active, creating a floor of demand. Recently, Tron founder Justin Sun eyed a $100 million Bitcoin purchase, reinforcing the trend of high-net-worth liquidity continuing to enter the market alongside public entities.
Furthermore, the scope of adoption has widened beyond corporations to sovereign entities.
Disclaimer: Coinspeaker is committed to providing unbiased and transparent reporting. This article aims to deliver accurate and timely information but should not be taken as financial or investment advice. Since market conditions can change rapidly, we encourage you to verify information on your own and consult with a professional before making any decisions based on this content.
Daniel Frances is a technical writer and Web3 educator specializing in macroeconomics and DeFi mechanics. A crypto native since 2017, Daniel leverages his background in on-chain analytics to author evidence-based reports and deep-dive guides. He holds certifications from The Blockchain Council, and is dedicated to providing "information gain" that cuts through market hype to find real-world blockchain utility.
Bitcoin options traders are increasingly positioning for a downside move, paying a significant premium for protection as the asset struggles to reclaim the $70,000 mark. New derivatives data indicates a structural shift that could point to a retest of the $60,000 support level in the coming weeks alongside continued spot market weakness.
It has been 35 days since the Bitcoin Coinbase Premium was positive.
Professional traders are currently paying a 13% premium for put options relative to calls, a metric that signals elevated caution. Under neutral market conditions, the delta skew typically hovers between -6% and +6%. The persistence of this premium over the last four weeks suggests institutional sentiment has shifted decisively to a defensive stance. This aligns with recent spot market patterns, where analysts have warned that Bitcoin could drop towards lower support levels amid institutional selling.
The technical structure of the options market reveals specific strategies being deployed on exchanges like Deribit. Data indicates that traders are favoring bear diagonal spreads and short straddles, strategies that typically profit from stagnation or moderate downside. The options market structure implies short gamma buildup that could impact spot liquidity, particularly if support at $66,000 fails to hold.
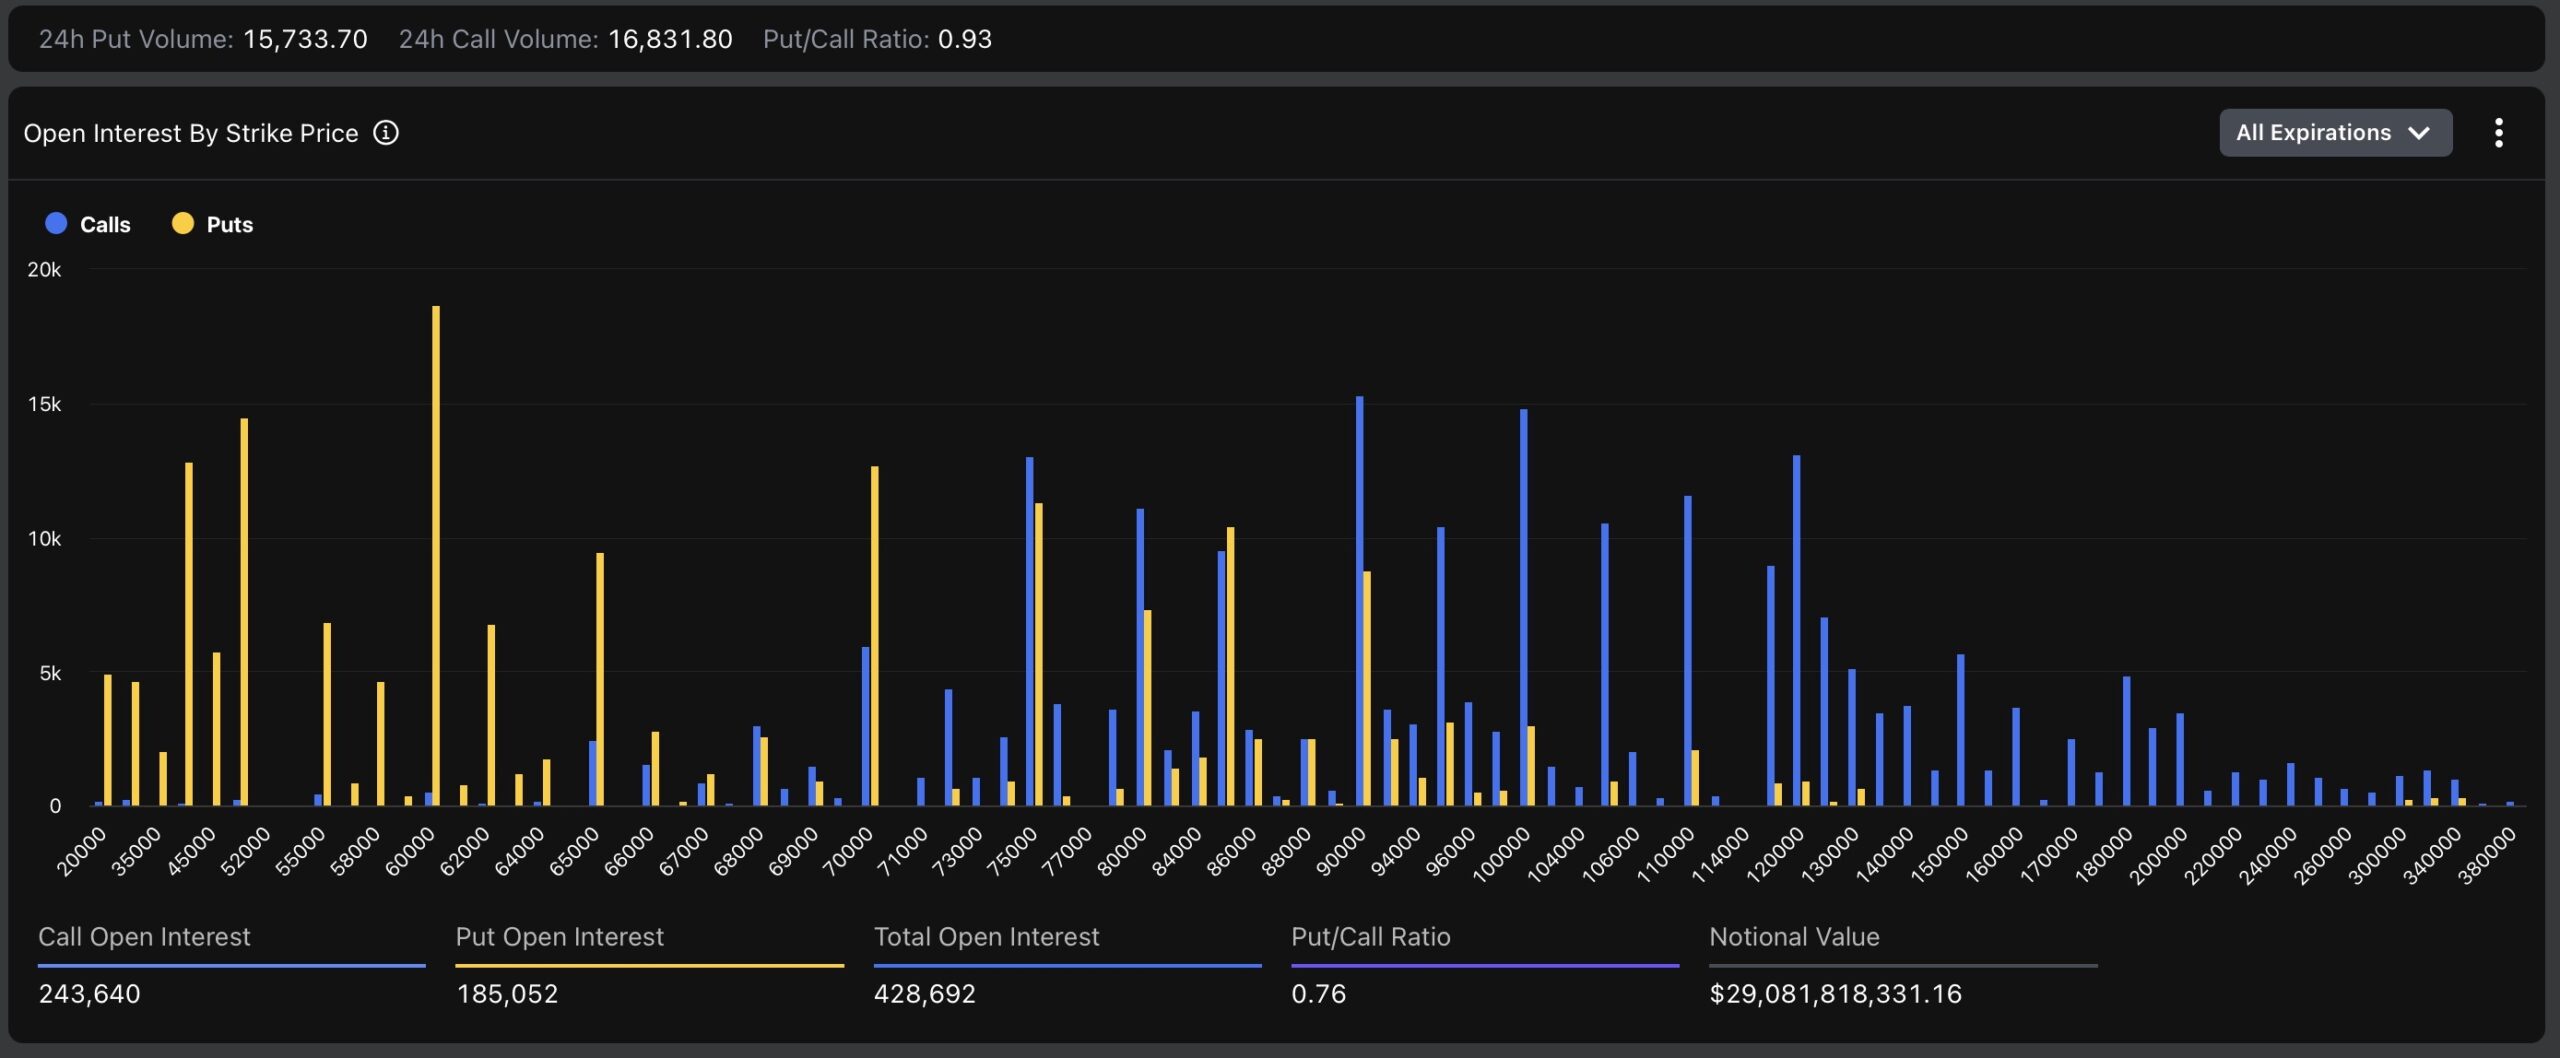
Prediction markets are also responding to the shifting sentiment. Current odds suggest a higher probability of Bitcoin’s price testing $65,000, though it may be lower. Another bearish indicator is the demand for stablecoins in Asia; the USDT premium against the Chinese Yuan has flipped to a 0.2% discount, signaling a lack of urgent buy-side pressure. While some analysts note that a $40,000 BTC put stands out in open interest, this likely represents deep out-of-the-money hedging rather than a primary price target for the majority of the market.
For semi-professional investors, the convergence of negative spot flows and defensive options positioning warrants caution. The effective bet by market makers appears to be a test of $60,000 rather than an immediate rebound. Traders should monitor ETF flow data closely; a reversal there is likely required to neutralize the current bearish options skew.
On Feb. 19 (ET), spot Bitcoin ETFs recorded a total net outflow of $166 million, marking the third consecutive day of net outflows. Spot Ethereum ETFs saw total net outflows of $130 million, with BlackRock’s ETHA leading at $96.80 million in net outflows. https://t.co/Hj2Gs49bWapic.twitter.com/fNPHmfvyVJ
Despite the short-term negative price action, the infrastructure for institutional derivatives continues to mature. Recent developments, such as Ripple Prime’s integration with Hyperliquid, highlight the growing sophistication of on-chain trading access. As these platforms evolve, they may offer traders more granular tools to manage standard deviation risks during corrective phases like the current one.
Disclaimer: Coinspeaker is committed to providing unbiased and transparent reporting. This article aims to deliver accurate and timely information but should not be taken as financial or investment advice. Since market conditions can change rapidly, we encourage you to verify information on your own and consult with a professional before making any decisions based on this content.
Daniel Frances is a technical writer and Web3 educator specializing in macroeconomics and DeFi mechanics. A crypto native since 2017, Daniel leverages his background in on-chain analytics to author evidence-based reports and deep-dive guides. He holds certifications from The Blockchain Council, and is dedicated to providing "information gain" that cuts through market hype to find real-world blockchain utility.