
Bitcoin rebounded from $112,000 following macroeconomic uncertainty, with technical analyst CrypNuevo identifying key liquidation clusters that could trigger a short squeeze toward $119,000.
Bitcoin BTC $68 219 24h volatility: 3.1% Market cap: $1.36 T Vol. 24h: $29.37 B price has once again experienced high volatility events in a short period of time, flirting with its previous all-time high just to retrace back to the $112,000 level, following macroeconomic uncertainty triggered by unexpected jobs data. An analyst, however, had previously warned of a long squeeze targeting these levels—now potentially serving as a launchpad for an upward move.
CrypNuevo is a renowned Bitcoin trader and analyst, with remarkable accuracy in his technical analyses that usually consider open interest liquidity as a main driver for price.
In particular, the analyst warns of two liquidity clusters at $116,800 and $119,000, which could act as price magnets in the following days, likely causing a short squeeze. The movement could already be in motion right now, but it could also come after another retracement testing the $110,000 support, explains CrypNuevo.
$BTC liquidity update:
Liquidations are also starting to show up on the heatmap around $116.8k and $119k.
From a swing trading perspective, I still lean toward a push into that liquidity zone – potentially from $113k (1D 50 EMA) or $110k (structural support).
Lower? doubtful pic.twitter.com/SamV0hHu4A
— CrypNuevo 🔨 (@CrypNuevo) August 6, 2025
A short squeeze is what happens when the BTC price surges aggressively, hitting levels with a high concentration of programmed liquidations from short-sellers. The price action triggers these liquidations, creating more bids for Bitcoin—as part of the liquidation process—and pushing the price further up for more liquidations in a row. Something similar can occur to the downside, targeting long position liquidations, which is called a long squeeze.
Bitcoin Price Analysis by CrypNuevo and Stock Market Correlation
On January 27, CrypNuevo warned of significant liquidation clusters to the downside, targeting a price range between $113,600 and $114,500, explaining the main liquidity was at the lowest price. The long squeeze proceeded as expected and continued further, testing the 50-day exponential moving average (1D50EMA), an indicator often highlighted by the analyst. Other cryptocurrencies, like Ethereum ETH $2 063 24h volatility: 4.1% Market cap: $248.96 B Vol. 24h: $15.18 B , also experienced the drop, losing important support levels.
In a follow-up to his previous analysis, CrypNuevo drew comparisons to price action seen in January 2025, but explained that the downside move would likely stop around the 1D50EMA, setting support for a comeback—differently from what happened earlier this year.
$BTC Sunday update:
Is January's Price Action repeating now?
The reversal PA was almost identical at the highs since it's a common pattern for a pullback after reducing momentum.
However, the current situation is very different and it's unlikely PA repeats further:
🧵↓ (1/5) pic.twitter.com/hoWesUACSL
— CrypNuevo 🔨 (@CrypNuevo) August 3, 2025
As of this writing, Bitcoin is already trading at $115,470, showing signs of a recovery together with the S&P 500 (SPX), which represents the US stock market. Both financial assets have a relevant correlation, observable in the chart below, and are very sensitive to macroeconomics. Recent unexpected jobs data brought back recession fears to investors, partially explaining the price drop for BTC and stocks.

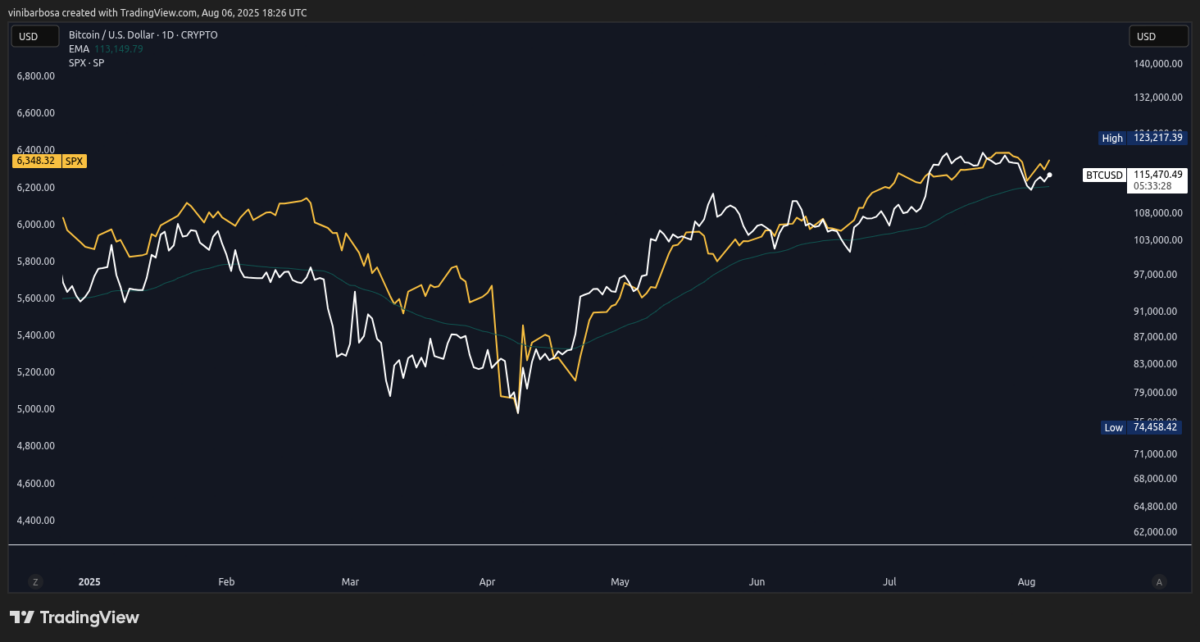
Bitcoin (BTC) and S&P 500 (SPX) 1D Price Chart | Source: TradingView / Vini Barbosa
A more positive macro scenario or other ‘bullish’ news could fuel an upward movement in all markets, pulling Bitcoin towards the liquidation clusters up to $119,000, close to BTC’s current all-time high. A short squeeze in this region would bring more volatility to the space. Thus, traders should be cautious while positioning and creating further targets for the whales to hunt.
next