
In case the bulls increase their momentum and sustain it, there is a possibility that the pair would head towards the north with very strong momentum.
Key Highlights:
- The pair may resume its uptrend movement soon;
- the price may break out of the distribution territory;
- there is a probability of the bulls sustaining the trend.
BTC/USD Long-term Trend: Ranging
Distribution Territories: $7,383, $7,804, $8,380
Accumulation Territories: $6,807, $6,113, $5,848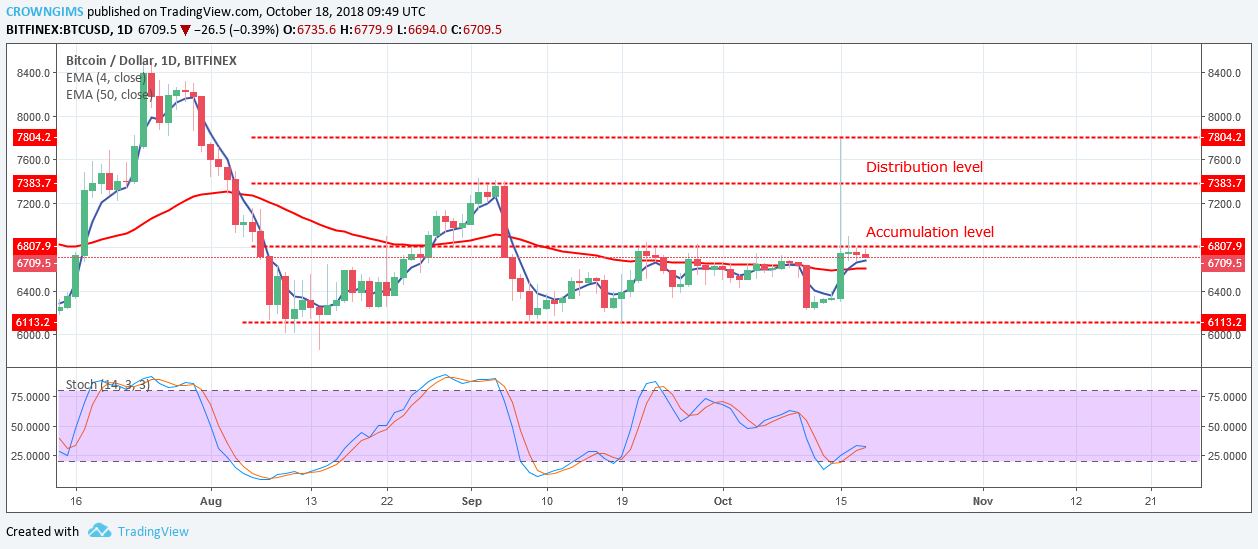

On October 15, the pair soared to the north with the full force from the bulls. It broke the distribution territories of $6,807, $7,383 and touch $7,804 but could not break it up. Suddenly the bears moved into the market with high pressure and returned the price back to the former consolidation zone (that is the range bound of $6,807 and $6,113), clearly shown on the daily chart as a top long-wick candle. The price has been right there to make the next move.
In case the bulls increase their momentum and sustain it, there is a possibility that the pair would head towards the north with very strong momentum. In the same vein should the bears increase their momentum and break down the support levels of $6,113, the pair will head towards the lower accumulation territory of $5,848.
BTCUSD Medium-term Trend: Ranging
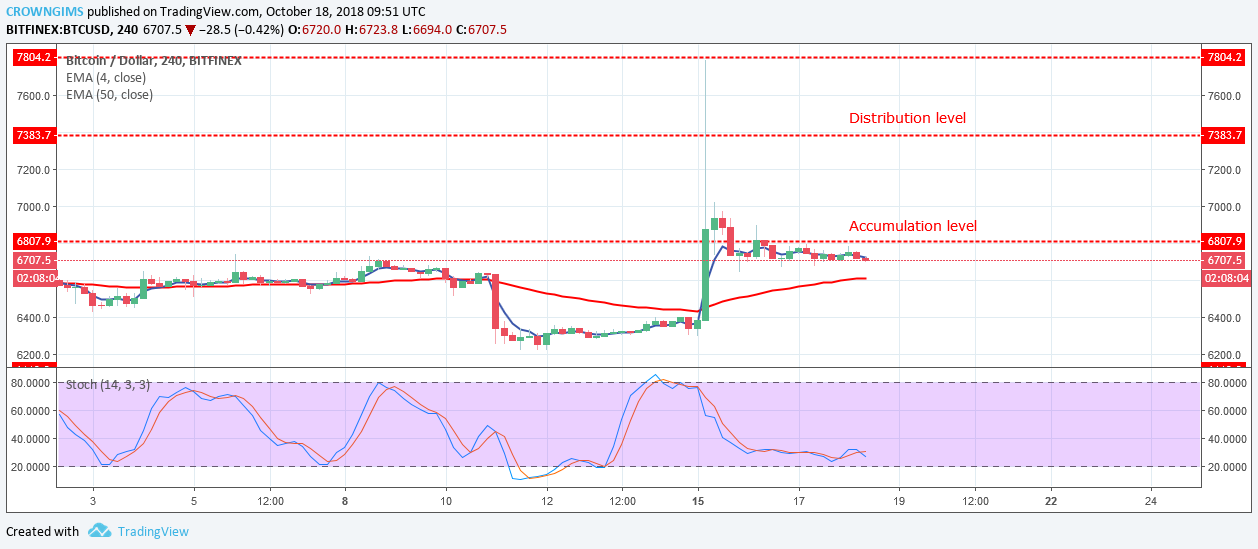
As at the moment, the price is on the 10-day EMA and 50-day EMA. Meanwhile, the two EMAs are parallel to each other indicate consolidation is ongoing. However, the Stochastic Oscillator is above level 20 with its signal lines point to the south indicates sell signaling.
next