
Alongside on-chain data, historical cycle patterns also suggest Bitcoin may be on the verge of a breakout.
Recent data from CryptoQuant shows that Bitcoin BTC $65 965 24h volatility: 10.1% Market cap: $1.32 T Vol. 24h: $119.38 B might be gearing up for a rally. According to a CryptoQuant analyst under the pseudonym Darkfost, key on-chain metrics suggest a move toward a bullish phase, with signs that market sentiment is turning positive.
Key On-Chain Metrics Indicating Recovery
One of the primary indicators highlighted by Darkfost is the 7-day Simple Moving Average (SMA) of the Fund Flow Ratio, which is currently at 0.05. Historically, this level has marked the end of bear markets or the start of new bullish phases. A recent increase in the Fund Flow Ratio hints at rising investor activity on the exchanges, a sign that usually precedes sharp price surges.

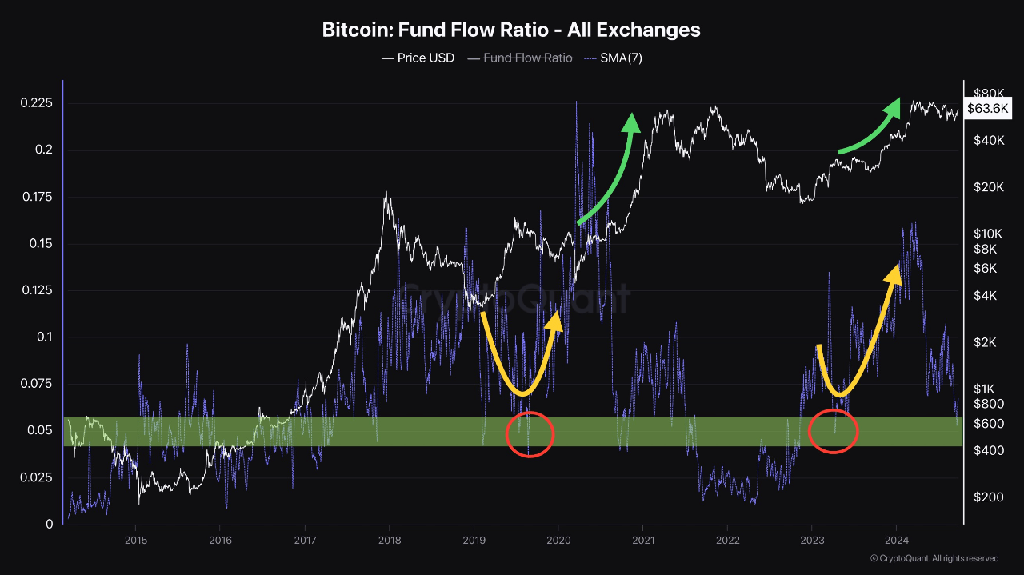
Credit: CryptoQuant
Another critical metric pointing toward recovery is the 30-day SMA of the Estimated Leverage Ratio. This metric tracks leverage use in Bitcoin trading. Currently, the ratio is trending upward within a support range of 0.15 and 0.175. This reflects increased confidence by market participants. Increasing leverage is further confirmed by rising interest in futures ETFs and Bitcoin options trading.
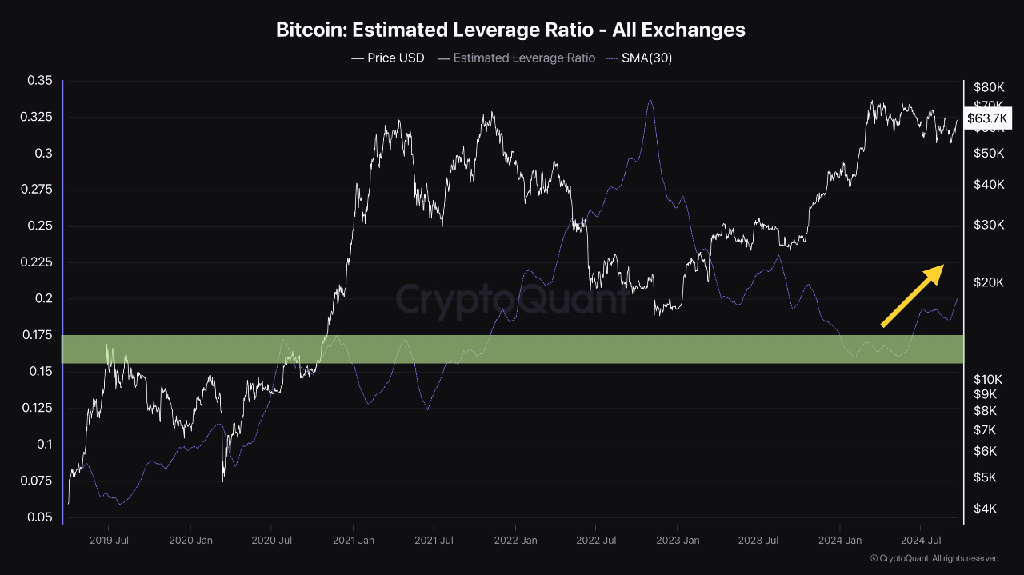
Credit: CryptoQuant
Darkfost also draws attention to the 30-day Exponential Moving Average (EMA) of Binary Coin Days Destroyed (CDD). This indicator monitors the activity of long-term Bitcoin holders. A sharp rise in this metric often signals the end of a bear market phase. For now, the long-term holders seem to be positioning themselves for future gains, which could provide further support for Bitcoin’s price in the months ahead.
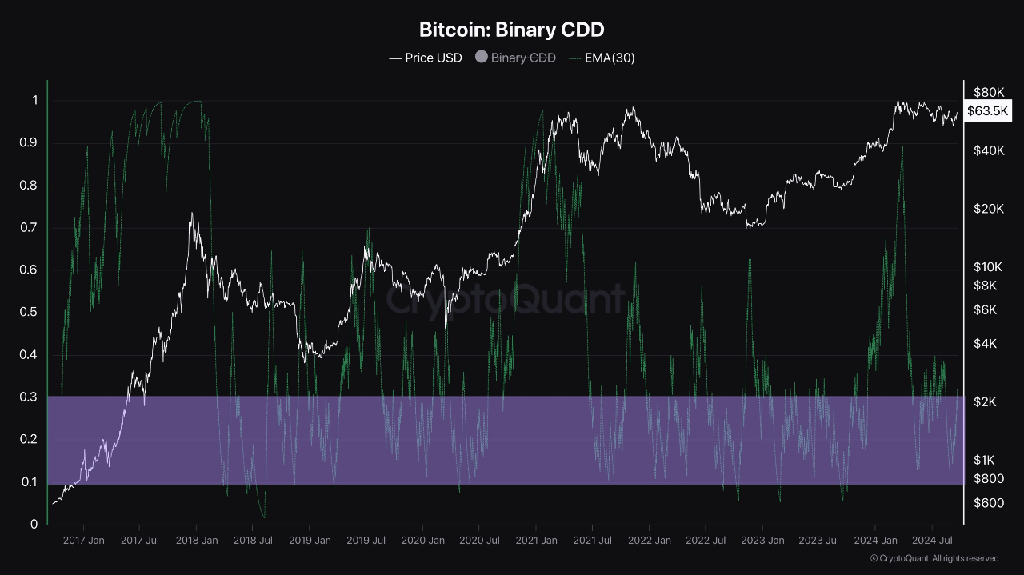
Credit: CryptoQuant
Historical Trends Suggest a Bullish Breakout
Alongside on-chain data, historical cycle patterns also suggest Bitcoin may be on the verge of a breakout. In an X post, pseudonymous analyst Rekt Capital noted that Bitcoin tends to break out from its reaccumulation phase around 154-161 days after a halving event. If this argument stands, a breakout might be near since 157 days have passed since the latest halving.
While historical trends are no guarantee of future price movements, Bitcoin also behaved similarly in 2016 and 2020. Furthermore, the usually bearish month of September surprised many this year with the month 9% in green. This marks the second-best September performance for Bitcoin since 2016.
Long-Term Outlook Remains Positive
The long-term outlook for Bitcoin remains positive. It’s unclear exactly when or how big the next price jump will be, but recent data shows Bitcoin could be close to a strong rally. Bitcoin is now just 14.6% below its previous peak of $73,738. The next few days could be important in deciding Bitcoin’s price trajectory.
In the coming months, the upcoming U.S. elections are expected to influence market sentiment, though experts believe the impact may be minimal. Both candidates have expressed interest in crypto, with Trump being more vocal and showing strong support.
next