
The support zone of $218 may be broken and Bitcoin Cash price will have its low at the support level of $115 in case, the bears maintain or increase their pressure.
Key Highlights:
- Bears are in control of Bitcoin Cash market;
- the downtrend may continue;
- price pullback is inevitable.
BCH/USD Price Long-term Trend: Bearish
Resistance zone: $332, $410, $501
Support zone: $218, $155, $095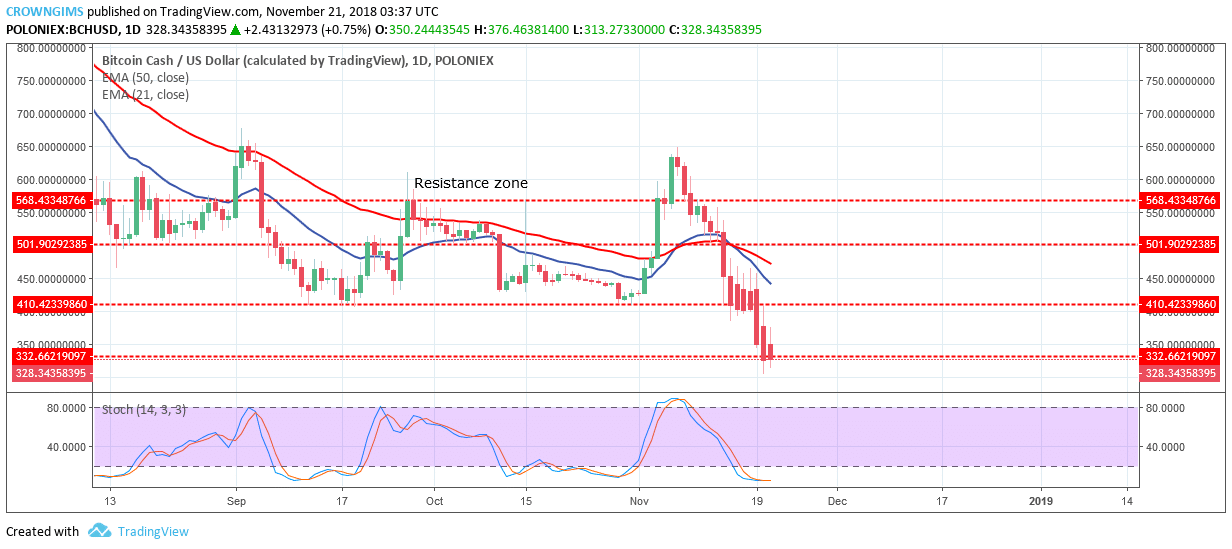

At present, the bearish inside bar candle formed on the support zone of $332 is an indication that the bearish trend may continue. The coin is under the21-day EMA and 50-day EMA with the former crossed the later downside which is an indication of strong bearish pressure and also shows that downtrend is ongoing. However, the stochastic Oscillator period 14 is at oversold level (below 20 level ) indicate strong selling in the BCH market and the bulls may gain momentum soon.
In case, the bears maintain or increase their pressure, the support zone of $218 will be broken and BCH will have its low at the support level of $115. If the support zone of $218 holds the traders may place buy setup at the level and go long.
Medium-term Trend: Bearish
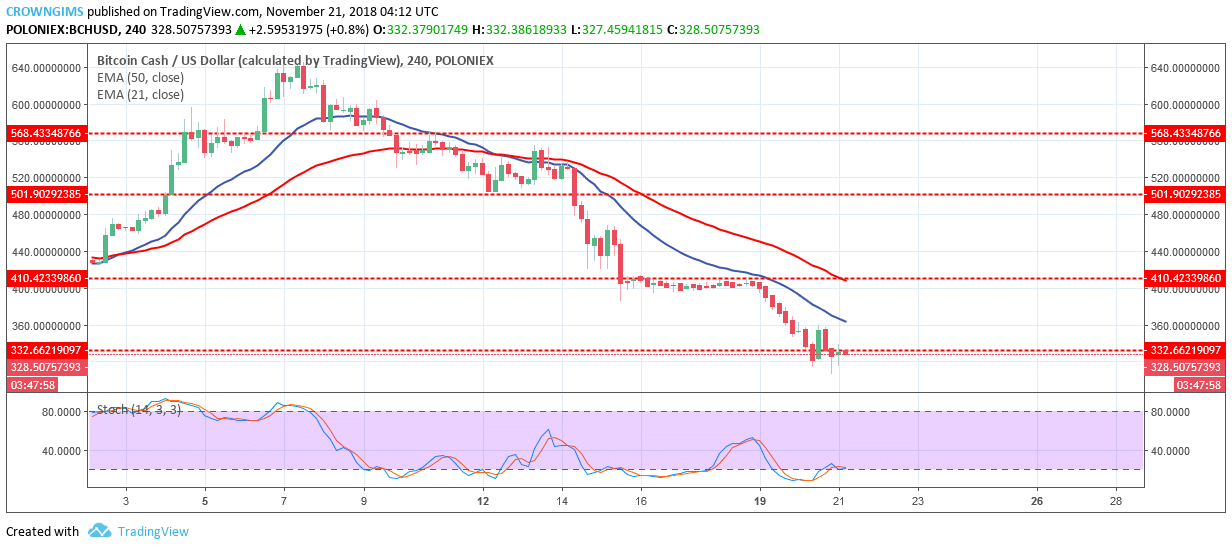
The bearish trend continues as long as the coin remains under the 21-day EMA and the 50-day EMA with the two EMAs well separated and the coin distance from the EMAs. The Stochastic oscillator period 14 is at the oversold region with the signal line point down indicate a further decrease of Bitcoin Cash price.
next