
Bitcoin fell below $92,300 as a congressional probe into President Trump triggered risk-off sentiment. Short-term holders transferred over 65,000 BTC to exchanges, adding $610 million in potential sell pressure.
Bitcoin BTC $68 996 24h volatility: 2.5% Market cap: $1.38 T Vol. 24h: $24.23 B price plunged to $92,300 on Tuesday, Nov. 18, as US stocks staggered during a critical congressional vote launching a probe into President Trump. The political turbulence pulled risk sentiment lower, with the Nasdaq down 0.59% and the S&P 500 lower by 0.35%. Bitcoin traders reacted sharply, moving unusually large volumes of BTC into exchanges.
The drop below $92,300 came despite positive sentiment earlier in the week after Michael Saylor confirmed Strategy’s $835 million Bitcoin purchase on Monday. While strategic whales continue accumulating into weakness, on-chain data suggests short-term holders are unwinding positions at a much faster pace.
According to CryptoQuant analyst JA Maartun, short-term holders shifted 65,200 BTC to exchanges at a loss. The attached P&L chart posted on X tracks the complete short-term holder loss profile during the transfer. At current prices near $93,500, the inflow represents roughly $610 million in potential fresh sell-side supply.

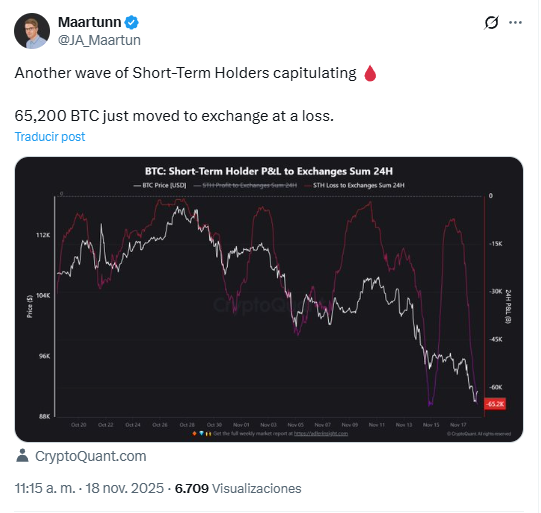
CryptoQuant analyst JA Maartun | Source: X.com
Such large exchange deposits typically weaken immediate rebound prospects. According to CoinMarketCap data, Bitcoin’s trading volume increased more than 34% on Tuesday, despite flat price action, reflecting the impact of fresh supply entering the market. Without a catalyst to counter the political pressure on the crypto-friendly Trump administration, Bitcoin price could remain exposed to deeper corrective moves.
Bitcoin Price Forecast: Double-Top Breakdown Still Dominates Trend
Bitcoin price trades around $93,317, stabilizing after hitting the intraday lows near $90,900, but the broader trend remains defined by a completed double-top breakdown on the 12-hour chart. The pattern’s projected target sits near $89,177, matching the lower Bollinger Band and reinforcing the zone as the next major support.
The Bollinger Bands (20, SMA) show clear downside expansion. The upper band at $108,961 reflects the level Bitcoin must reclaim to negate the breakdown structure, while the mid-band around $99,069 is now acting as firm resistance. Bitcoin’s inability to close above that midpoint in recent sessions confirms persistent bearish momentum.

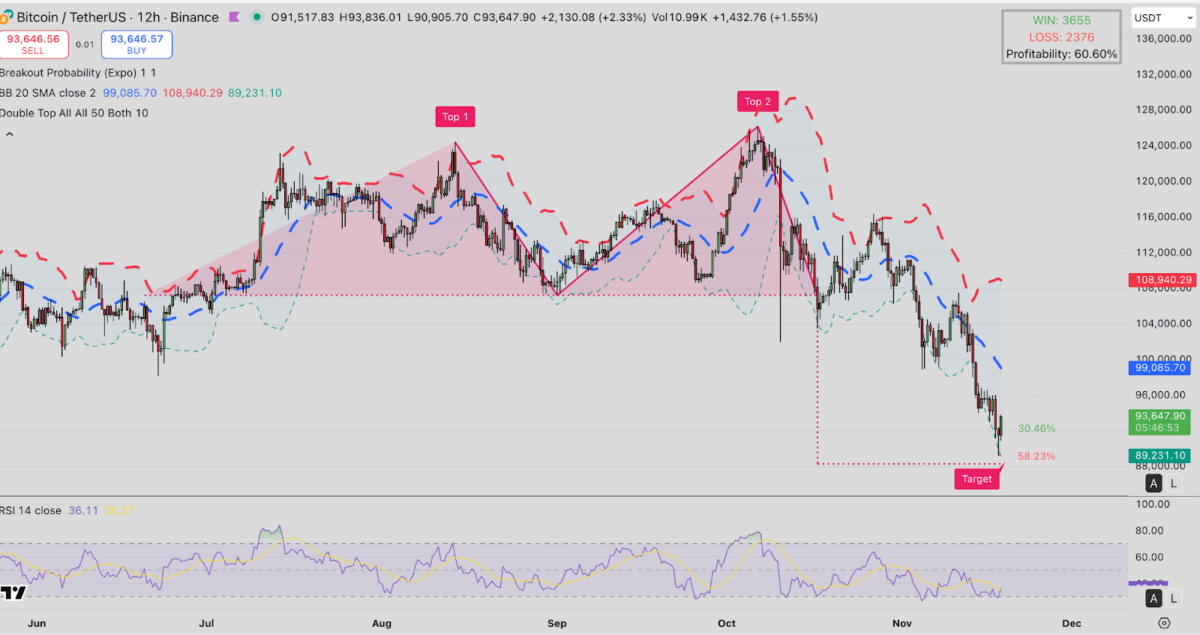
Bitcoin (BTC) technical price analysis | TradingView
The double-top profitability ratio at 60.60% and a 58.23% downside completion highlight that bears have already executed the bulk of the pattern but still retain control until the lower target is tested or invalidated. The breakout probability tool at 1.00 also reflects that BTC remains fully aligned with the downside continuation setup.
RSI on the 12-hour timeframe sits at 35, hovering just above oversold conditions. While this typically signals a potential relief bounce, BTC has historically continued lower when RSI trends flat beneath 40 during high-volume exchange inflows, similar to conditions highlighted this week.
Bitcoin will need to reclaim the $99,000–$100,000 region to shift the forecast away from the bearish target. Failure to do so increases the likelihood of a retest of $89,000, especially if political volatility or further short-term holder capitulation persists.
next