
Bitcoin Market Structure Weakens After $5,000 Drop
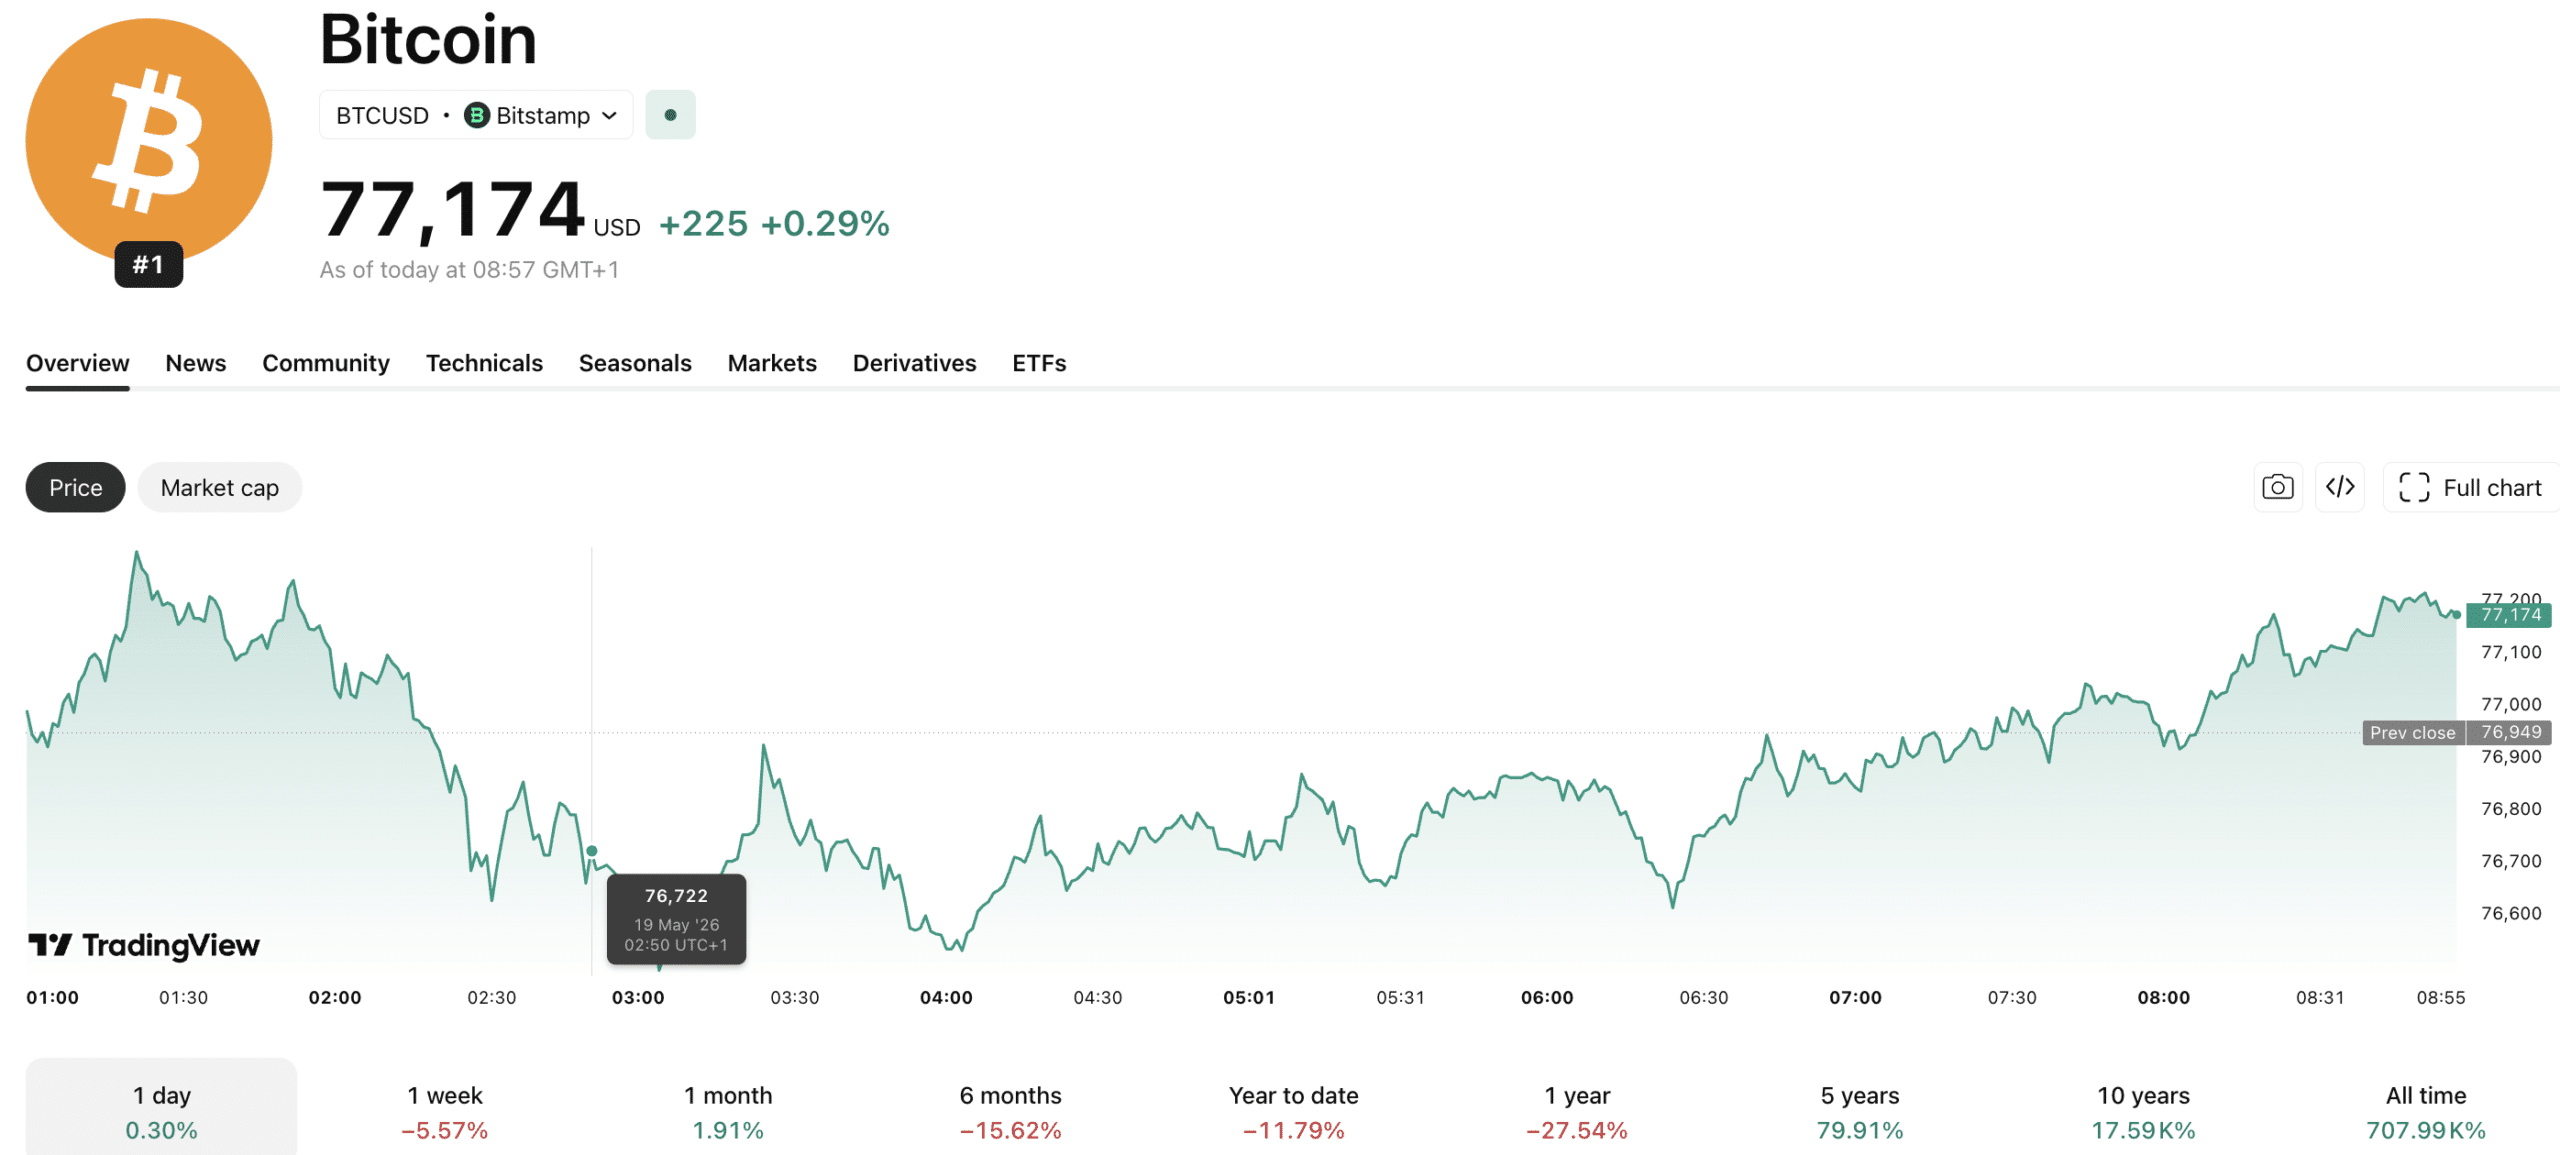
Bitcoin traded near $77,100 at press time, down approximately -7% from $82,000 in a matter of days, a $5,000 decline that, on the surface, resembles a routine pullback from an extended rally that began near $60,000.
The analytical question is no longer whether this Bitcoin selloff can be dismissed as noise; it is whether the structural conditions underneath the price action have already committed the market to a deeper leg lower.

Three converging signals, accelerating institutional ETF outflows, aggressive selling across spot and futures markets, and rising demand for protective options, are all pointing in the same direction.
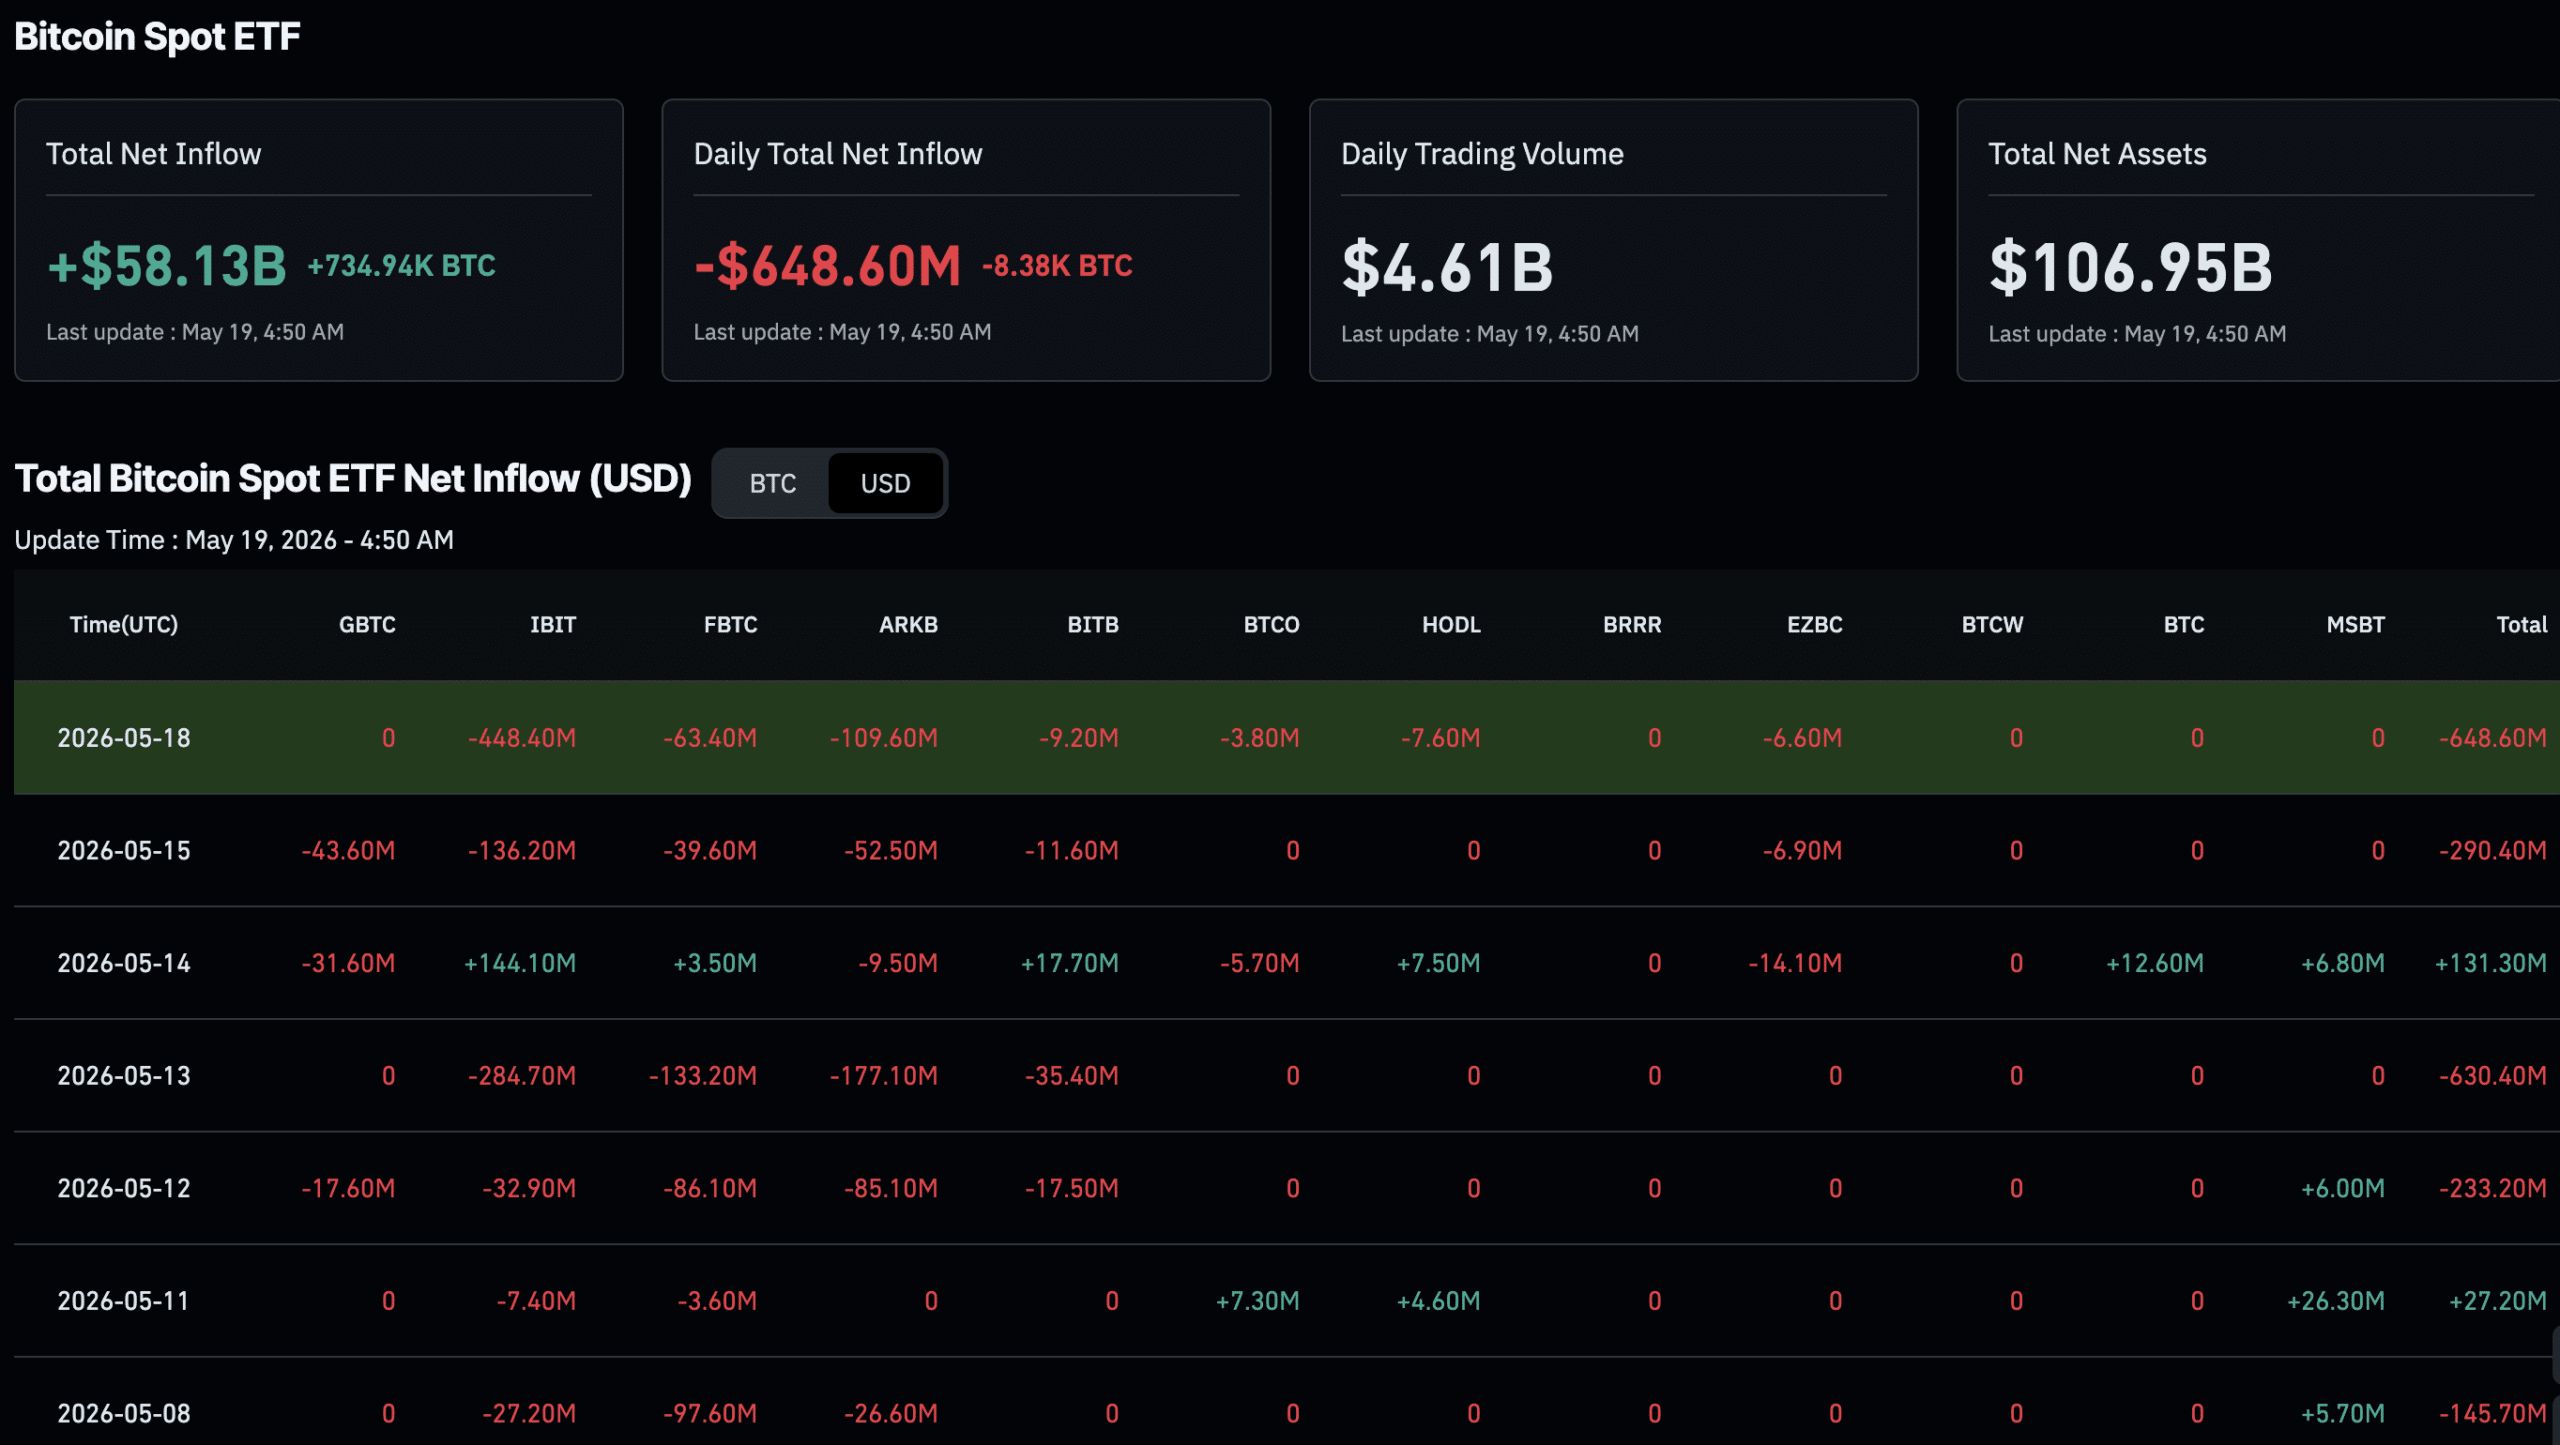
The most immediate data point reinforcing that concern comes from institutional ETF flows. US-listed spot bitcoin ETFs have shed over $1.5Bn since May 7, according to SoSoValue data, with Monday’s single-day withdrawal hitting $648M, the largest since January 29 and the second time in a week that daily redemptions have exceeded $600M.
Higher low being put in
I believe we trade back above 80k well before the monthly close.
Wrong on a D3 close below 75k, at which point I will switch bias.
They will not shake me pic.twitter.com/Vc2CCyt8Wo
— Trader Koala (@trader_koala) May 18, 2026
Can Bitcoin Price Hold $76,000 After the $5,000 Flush?
The key support zone for Bitcoin is near $76,000, with a wider demand range between $74,000 and $75,000, reflecting the historical acquisition cost for short-term holders who may sell when prices near their buy levels.
The 50-day simple moving average is critical; a daily close below it has often indicated a shift from correction to a sustained downtrend. Current indicators show deteriorating momentum, with the RSI below 45 and the MACD crossing into negative territory.
Vikram Subburaj, CEO of Giottus exchange, warns that a breakdown below this support could lead to a deeper correction, with a clean loss of $76,000 exposing the $74,000–$75,000 region as the next test.
Leverage Flush and ETF Outflows: What the On-Chain Data Is Actually Showing
The on-chain data and derivatives analysis highlight significant technical warnings in the crypto market. The Cumulative Volume Delta (CVD), tracked by Glassnode, has plummeted, with aggregate spot CVD dropping from $16.9M to negative $126.2M during the recent selloff, indicating aggressive selling. Perpetual futures CVD has fallen even more, reaching negative $368.5M, suggesting futures traders are not waiting for dip-buyers before shorting.
Crypto liquidations have added to selling pressure, triggering a cascade of stop-outs that force long positions to close. Liquidation data shows a concentrated long overhang before the decline, and open interest hasn’t fallen enough to signal that selling pressure is over.

Additionally, options positioning reflects increasing caution. Glassnode’s options delta skew has risen to 14.4%, signaling higher demand for put protection relative to calls, suggesting greater downside risk perception among traders. This suggests structural anxiety rather than opportunistic buying.
Finally, institutional ETF flow data support this outlook, showing a net outflow of $396M from spot bitcoin ETFs since May 1, reversing earlier inflows. Such swift outflows are unusual during routine corrections, highlighting market fragility linked to liquidity gaps rather than capitulation, suggesting that modest selling could trigger significant downward moves if ETF and futures demand decline.
Three Scenarios: How Far Can This Bitcoin Correction Go?

Bull case: If Bitcoin defends the $76,000 support zone on a closing basis and ETF outflow momentum stalls, the market could stabilize and attempt a recovery toward $80,000. That scenario requires a measurable shift back to net-positive institutional ETF flows and a reset in perpetual futures funding toward neutral – neither of which is currently in evidence. A reclaim of $80,000 would need to come with sustained spot CVD turning positive, not just a short-covering bounce.
Base case: Bitcoin consolidates in the $74,500–$77,500 range in the near term as the market digests excess leverage without a full capitulation. Funding rates drift toward neutral, open interest contracts gradually, and the price finds a temporary equilibrium below the prior $82,000 rejection. Bounces in this scenario are sold by institutional participants that have already begun reducing exposure through ETF redemptions, capping any recovery below $80,000.
Bear case: A confirmed daily close below $76,000 triggers the deeper correction that current derivatives and on-chain data are pricing in. The $74,000–$75,000 demand region becomes the next contested level; a failure there opens the path toward $70,000, where a more substantial liquidity pocket and longer-term moving average support converge.
Traders are now watching for confirmation signals: funding rates turning persistently negative, a steeper futures basis compression toward backwardation, or a spike in realized volatility that signals forced selling has reached an exhaustion point. Until those conditions appear, the current structure does not yet favor sustained recovery positioning.
next