
The increase in bullish pressure will push up Bitcoin price towards $5,459 resistance level; in case the level does not hold BTC may have its high at $5,574. Should the level of $5,459 holds, the Bears will push the coin down towards $5,255.
Key Highlights:
- Sideways movement may continue in the Bitcoin market in case the Bulls lose the pressure;
- the breakout at $5,459 level will expose Bitcoin price to $5,574 in case the Bulls gain more pressure;
- traders should be patient before taking a position.
BTC/USD Medium-term Trend: Ranging
Resistance levels: $5,459, $5,574, $5,840
Support levels: $5,255, $4,988, $4,742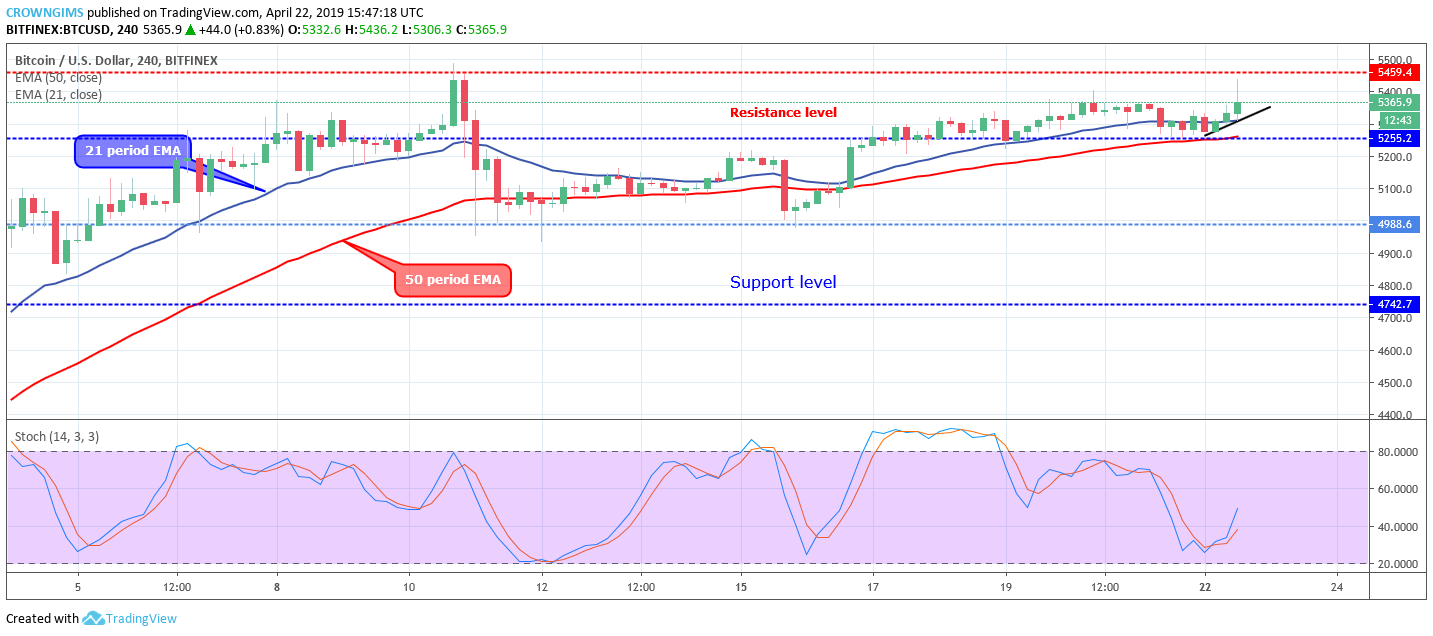

On April 19, the Bulls made an attempt to push the coin downward but it was resisted at the dynamic demand level of 21 periods EMA. An attempt by the Bulls to push up the coin to reach the supply level $5,459 has not been made possible.
The coin has been hovering over the 21 periods EMA and 50 periods EMA with sluggish in Bitcoin price. The Stochastic Oscillator period 14 is at 40 with the signal lines pointing upward to indicate a buy signal.
The increase in bullish pressure will push up the coin towards $5,459 resistance level; in case the level does not hold BTC may have its high at $5,574. Should the level of $5,459 holds, the Bears will push the coin down towards $5,255.
BTC/USD Short-term Trend: Bullish
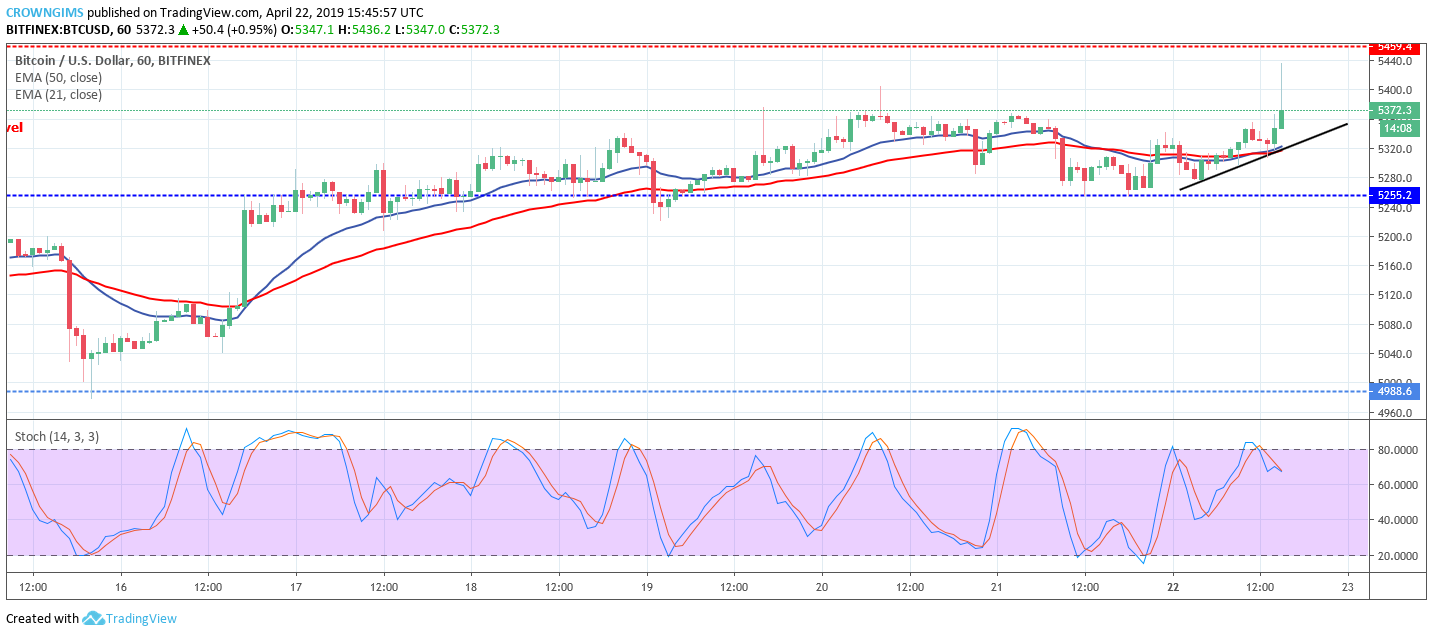
The 21 periods EMA is trying to cross the 50 periods EMA, to establish the bullish trend. The Stochastic Oscillator period 14 is at 70 levels with the signal lines pointing downward to indicate sell signal.
next