Bitcoin Price Analysis: BTC/USD Consolidates at $4,050, the Breakout is Imminent

On Mar 25, 2019 at 6:42 am UTC by · 2 mins read

In case the demand level of $4,050 does not hold and the Bears increase its momentum, Bitcoin price will find its support at $3,903 price level. Should the Bulls defend $4,050 price level, BTC will resume back to its uptrend movement.

Key Highlights:

  • Consolidation is ongoing in the BTC market;
  • Bitcoin price will target $3,903 in case $4,050 level does not hold;
  • the coin may find its resistance at $4,144 price level.

BTC/USD Medium-term Trend: Ranging

Resistance levels: $4,144, $4,254, $4,692
Support levels: $4,050, $3,903, $3,774On the Medium-term outlook, BTC/USD is ranging. BTCUSD was bullish on its trend last week. The bullish momentum placed Bitcoin price above the demand level of $4,050 and also above the two dynamic supports and resistance (21 and 50 periods EMA).

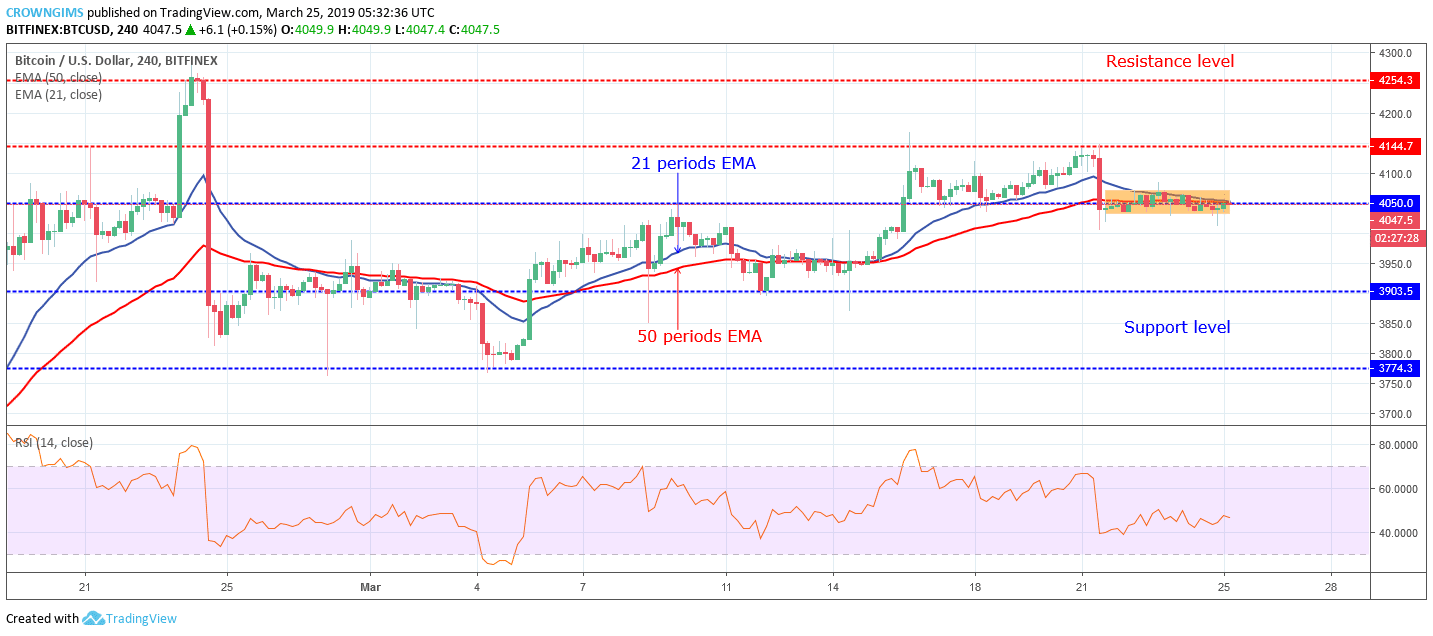
The Bulls lost their momentum at the significant resistance level of $4,144 and could not break up the level. A strong bearish candle formed declined the BTC price to the support level of $4,050 where it is currently consolidating.

Bitcoin price is hovering over the 21 periods EMA and 50 periods EMA with the two EMAs closed to each other which indicate that consolidation is ongoing in the BTC market. The Relative Strength Index is in zigzag movement around 40 levels to indicate sideways movement on the BTC 4-hour chart.

In case the demand level of $4,050 does not hold and the Bears increase its momentum, the coin will find its support at $3,903 price level. Should the Bulls defend $4,050 price level, the coin will resume back to its uptrend movement.

BTCUSD Short-term Trend: Bearish

The BTCUSD is on the bearish trend on the short-term outlook. The BTCUSD is bearishly trending within the “descending wedge” pattern formed on the BTC 1-hour chart. The breakout from the wedge pattern is imminent. The breakout at the upper trend line of the wedge will make the coin to rally towards $4,144. Likewise, the breakout at the lower trend line of the wedge will decline Bitcoin price towards $3,903 price level.

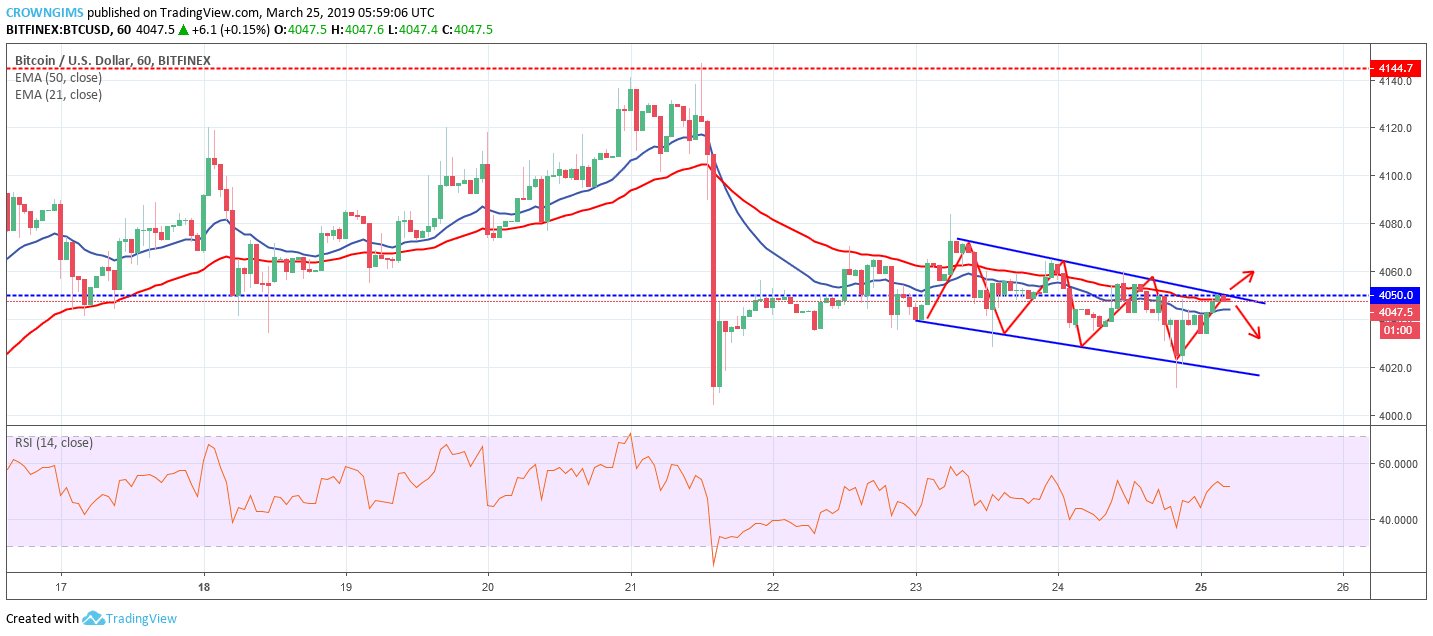
The BTC is trading below and over the 21 periods, EMA and 50 periods EMA within the wedge and the Relative strength index period 14 is above the 50 levels with signal line bending down to indicate sell signal.

Share:

Related Articles

Amboss Unveils RailsX: Lightning DEX Connects Bitcoin to $9.5 Trillion FX Market

By January 30th, 2026

RailsX introduces Lightning-native decentralized trading, eliminating intermediaries by routing transactions as circular self-payments through existing channels.

Trump Nominates Pro-Bitcoin Kevin Warsh for Federal Reserve Chair

By January 30th, 2026

Donald Trump nominates former Fed Governor Kevin Warsh as chair. Thai raises expectations of a more hawkish monetary policy stance pending Senate confirmation.

Crypto Selloff Explained: Bitcoin vs. Gold and 275K Traders Affected

By January 30th, 2026

Macroeconomic and geopolitical tensions have reignited the Bitcoin versus gold debate, contributing to a widespread market selloff.

Exit mobile version