
Should the Bullish candle penetrate the resistance level of $8,009 and close above it, Bitcoin price may move up towards $8,235. In case the Bearish candle penetrates the support level of $7,600 and close below it, $7,186 may be the next target.
Key Highlights:
- Bitcoin price is ranging at $7,812 level;
- the coin may rally towards $8,233 level
- the Bears may push the price to reach $7,085.
BTC/USD Medium-term Trend: Ranging
Resistance levels: $8,009, $8,235, $8,582
Support levels: $7,600, $7,186, $6,856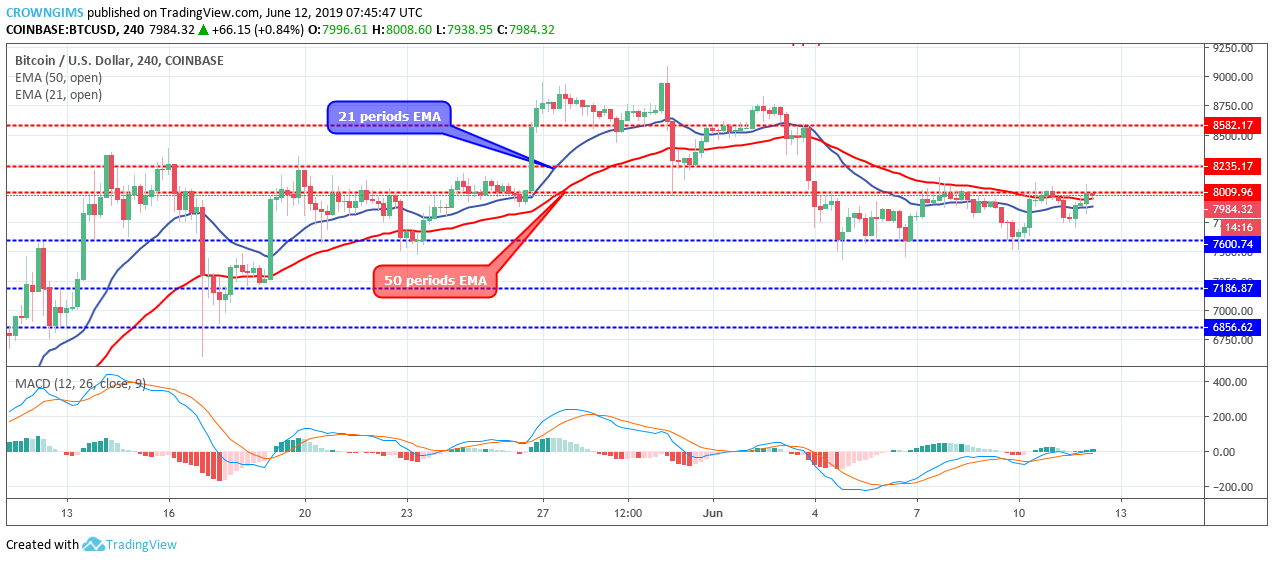

Consolidation may continue until the Bulls have enough momentum to break out at the $8,009 resistance level and rally towards $8,235 or the Bears break out at the support level of $7,600 and rally towards $7,186. As at the moment, the Bulls are trying to push up the price to break up the strong resistance level of $8,009.
Bitcoin price is hovering over the 21-period EMA and the 50 periods, the two EMAs are flat horizontally at the level as a sign of ranging movement in the Bitcoin market. The Moving Average Convergence Divergence period 12 is flat on the zero levels and the signal lines horizontally flat as well to indicate that consolidation is ongoing.
Should the Bullish candle penetrate the resistance level of $8,009 and close above it, Bitcoin price may move up towards $8,235. In case the Bearish candle penetrates the support level of $7,600 and close below it, $7,186 may be the next target.
BTC/USD Short-term Trend: Ranging
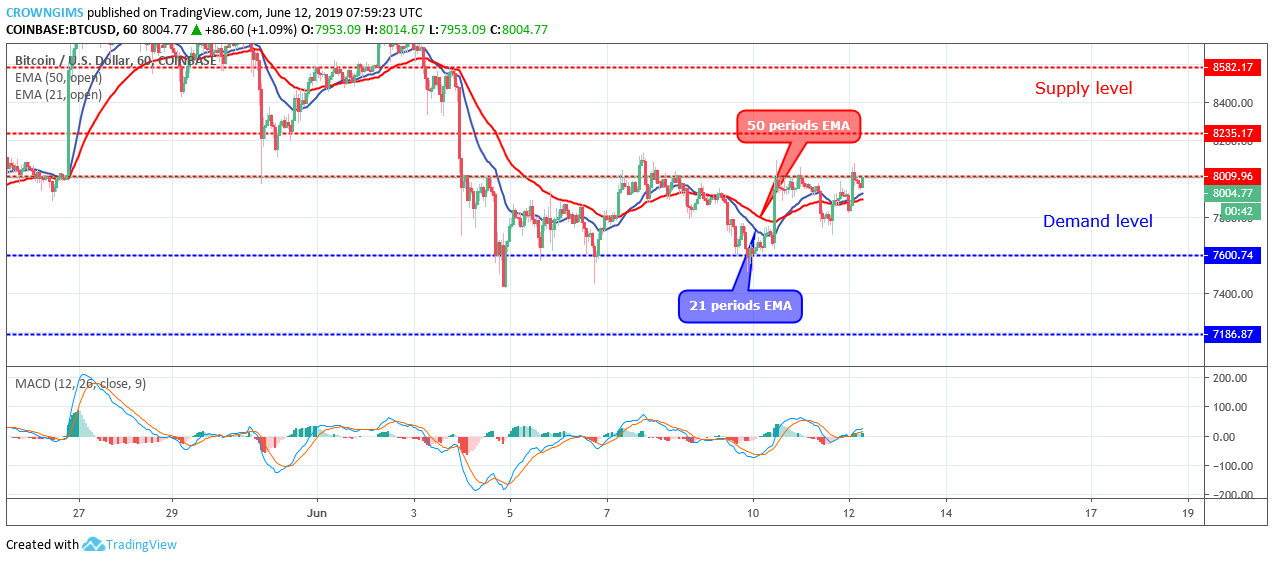
Bitcoin price is moving over and below the two EMAs in zigzag format. The Moving Average Convergence Divergence period 12 and its histogram together with the signal lines are flat horizontally at the level.
next