
Bitcoin’s 14-hour green candle streak coincides with significant whale activity, while market participants await clarity near the $95,000 mark.
Industry-leading cryptocurrency Bitcoin BTC $70 923 24h volatility: 0.4% Market cap: $1.42 T Vol. 24h: $35.74 B printed a massive 14 hourly candles consecutively on Friday, the longest streak since 2017, and it seems that whales are actively buying the current dip, suggesting an increase in buying pressure. As Inauguration Day for the pro-crypto administration nears, the digital asset market participants have their eyes set on BTC’s next move.
As clear from the chart below provided by TradingView, the 14 hours were printed between Jan. 9 at 9 PM GMT and Jan. 10 at 11 AM GMT. This price trajectory of Bitcoin has confused traders on social media platform X (formerly Twitter) because the market-leading cryptocurrency turned bearish in the last few days, dropping to a low of $91,771 and then rebounding to a daily high of $95,770.
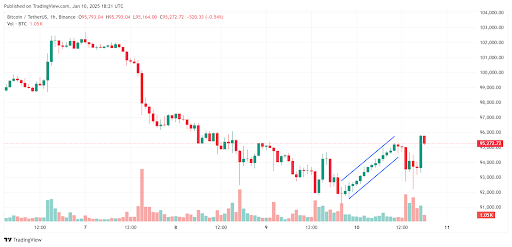

A senior analyst at K33 Research, Vetle Lunde, talked about this strange price action of BTC in an X post, confirming that this is the longest streak of green hourly candles that the market leader has printed since January 1, 2017, when it made 11 candles. The crypto community speculated on the possibility of an institutional buyer opening a new position for BTC.
A Deeper Dive into Bitcoin Price Action
According to CoinMarketCap data, Bitcoin is trading at $95,078 at the time of writing, up 2.52% in the past 24 hours. In the past week, the cryptocurrency has crashed 3.28% while plummeting 5.28% in the last 30 days. The digital asset is down 11.74% from its all-time high of $108,268 witnessed over 27 days ago.
The Relative Strength Index (RSI) for the Bitcoin price trajectory on the chart below reads a value of 46.73, which means that the sellers are dominating. However, the gradient of the line suggests that buyers are giving a pushback and aim to take control. A retest of $100,000 seems likely.
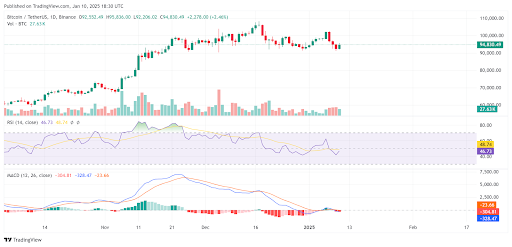
The MACD indicator confirmed a bearish divergence on the daily time frame for Bitcoin, as the signal line (red) rose above the MACD line (blue). The MACD histogram has also turned red, but since the lines are very close, either side could gain an advantage.
Finally, the data provided by Coinglass confirms that a massive $389.50 million was liquidated from the crypto market as Bitcoin unexpectedly broke above the $95,000 price level, turning the broader market bullish as well. In the past 4 hours, over $128.23 million was liquidated, which includes $82.70 million in BTC shorts.
next