
In case the support level of $73 holds the coin will break up the $80 resistance level and the bullish candle close above it, then it may have its target at $85 – $92, else further declination of Bitcoin SV price is certain.
Key Highlights:
- The bears still hold tight to the Bitcoin SV market;
- the Bulls may takeover in case there is break out at $80;
- the downtrend may continue.
BSV/USD Price Medium-term Trend: Bearish
Resistance levels: $80, $85, $92
Support levels: $73, $68, $61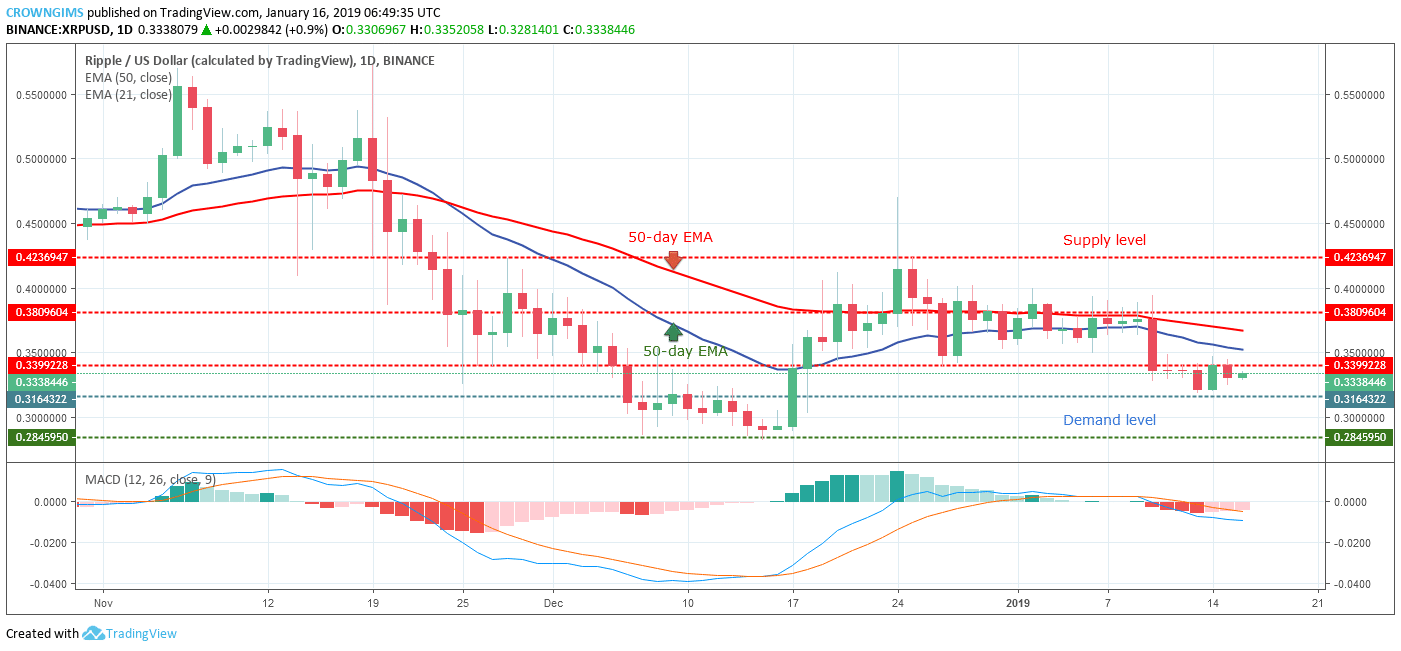

The bulls interrupted the bearish trend and the BSV price was returned to previous high above $85 price level later the bearish inside bar candle pattern formed pushed the coin below the EMAs.
The 21-day EMA and 50-day EMA are well sloppy with the cryptocurrency below the two EMAs which symbolize bearish trend in the BSV market. The Stochastic Oscillator period 14 is at 20 levels sloppy down connotes sell signal. In case the support level of $73 holds the coin will break up the $80 resistance level and the bullish candle close above it, then it may have its target at $85 – $92.
BSV/USD Price Short-term Trend: Bearish
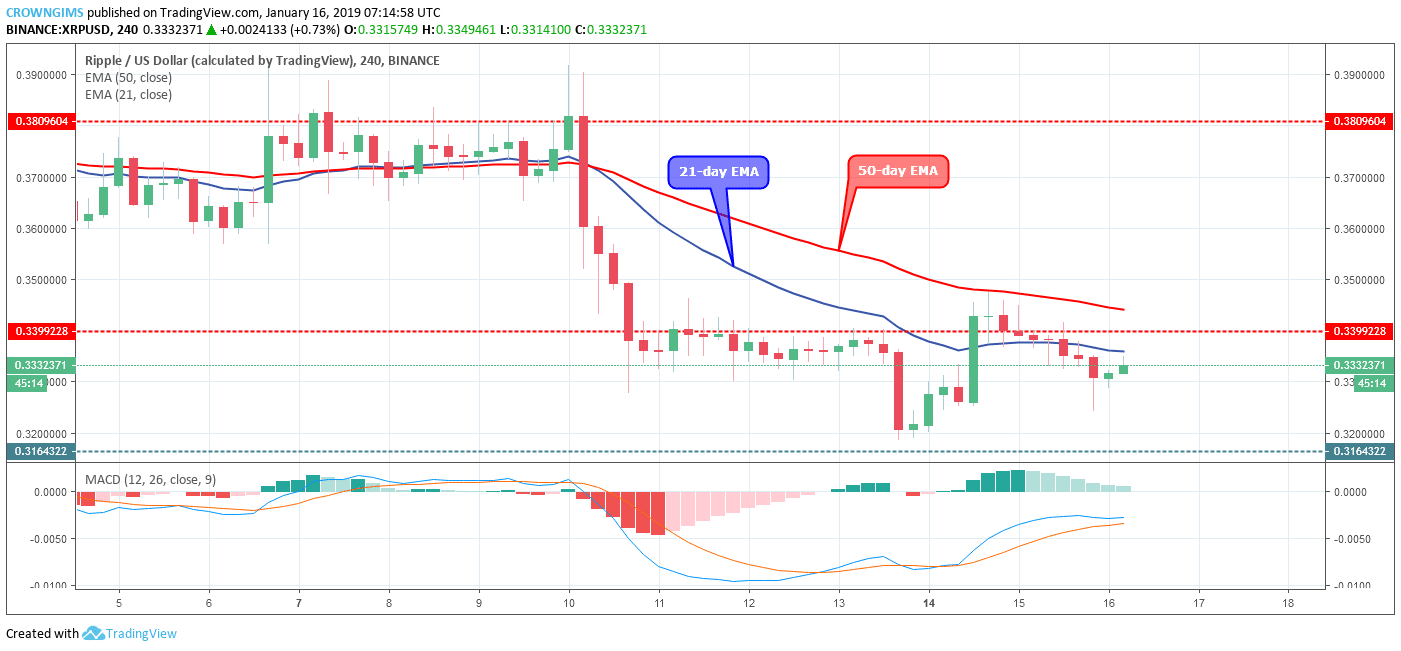
As at present, Bitcoin SV price is trading in-between the 21-day EMA and the 50-day EMA while the Stochastic Oscillator period 14 is above 60 levels with the signal lines pointing upward which indicates buy signal. It is only when the bulls would not penetrate the $80 price level we expect further declination of BSV price.
next