
Increase in bearish momentum while the bears defend the resistance level of $68 will break the support level of $54 and Bitcoin SV may find its low at $41 price level.
Key Highlights:
- The bears still hold onto the Bitcoin SV market;
- in case the bears defend the $68 price level, the coin may find its low at $41 price level;
- the downtrend may continue in case the bears increase their pressure.
BSV/USD Price Long-term Trend: Bearish
Resistance levels: $68, $85, $100
Support levels: $54, $41, $30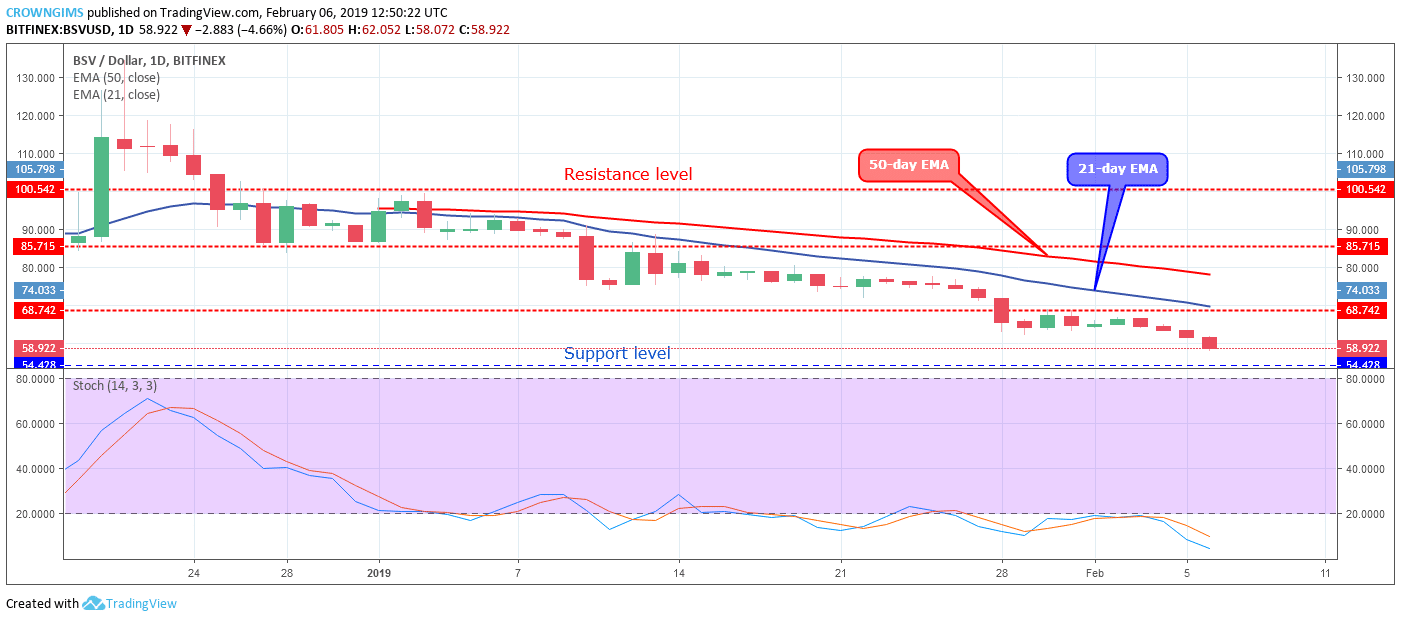

The Bitcoin SV is trading under the two EMAs slowly declining and the 50-day EMA is above the 21-day EMA. The Stochastic Oscillator period 14 is below 20 levels with its signal lines pointing down implies strong sell signal. Increase in bearish momentum while the bears defend the resistance level of $68 will break the support level of $54 and the coin may find its low at $41 price level.
BSV/USD Price Medium-term Trend: Bearish
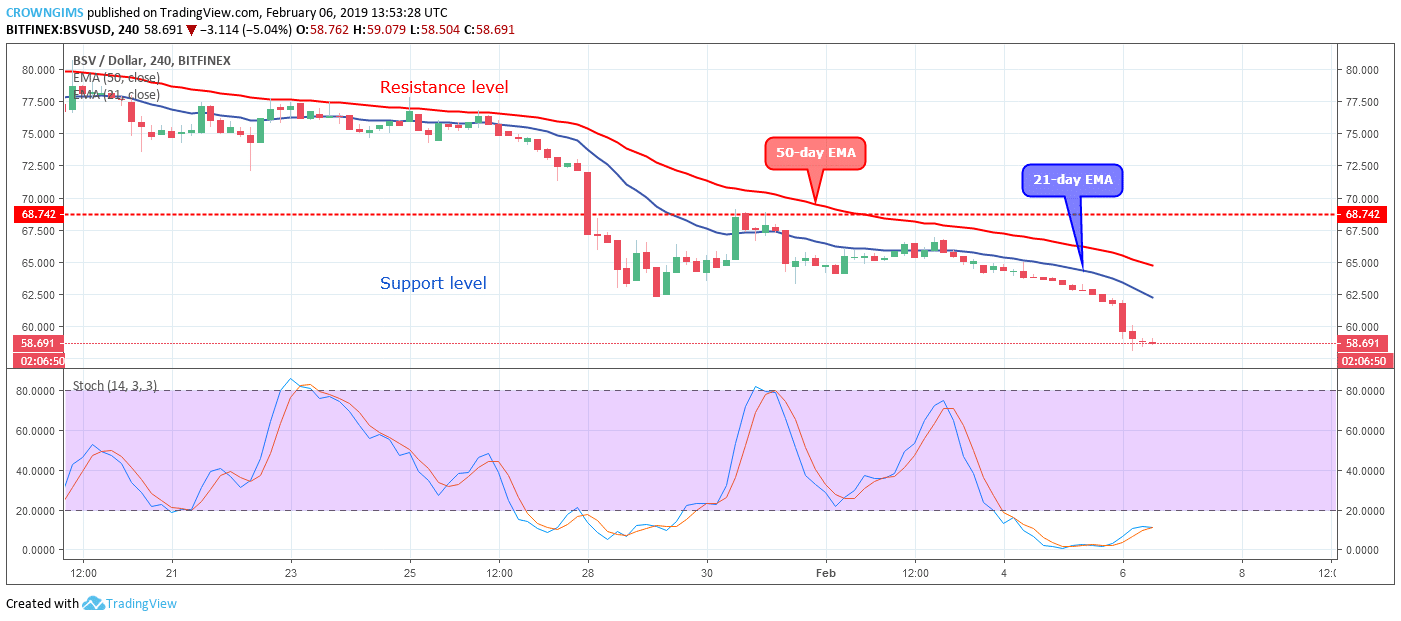
Bitcoin SV/USD remains on the bearish trend on the medium-term outlook. The bullish inside bar candle pattern formed on January 29 aided the upward movement of Bitcoin SV price towards the resistance level of $68 but unable to break up the resistance level and the bears pushed the cryptos down below the two EMAs, the coin is currently targeting the support level of $54.
BSV price is currently trading below the 21-day EMA and 50-day EMA and it is moving away from the two EMAs which imply an increase in bearish momentum. The Stochastic Oscillator period 14 is below 20 levels (oversold level) and the signal lines bending down connote further declination of Bitcoin SV price.
next