
A clear break and weekly close below the demand zone of $0.08 would interrupt the bullish testing supply zone of $0.11 and the demand zone of $0.07 would be exposed.
Key Highlights:
- Further downward movement is possible next week;
- rectangular pattern confirmed;
- traders should watch for the break out confirmation.
ADA/USD Price Long-term Trend: Bearish
Supply Zones:$0.11, $0.13, $0.17
Demand Zones: $0.08, $0.07, $0.06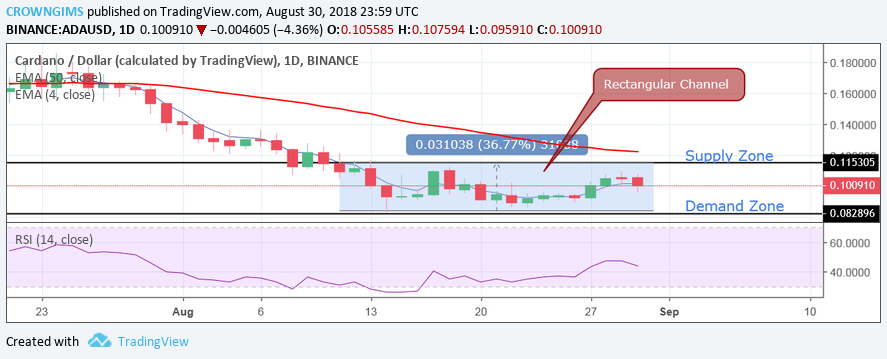

The EMA 4-day still remains below the 50-day EMA and ADAUSD remains below the 4-day EMA. On the daily chart, more bearish candles are formed, which indicate the possibility of the downtrend continuation. On the downside, a clear break and weekly close below the demand zone of $0.08 would interrupt the bullish testing supply zone of $0.11 and the demand zone of $0.07 would be exposed. The RSI 14 is below the 50-level pointing towards the south. Further downward movement is possible next week.
ADA/USD Medium-term Trend: Bearish
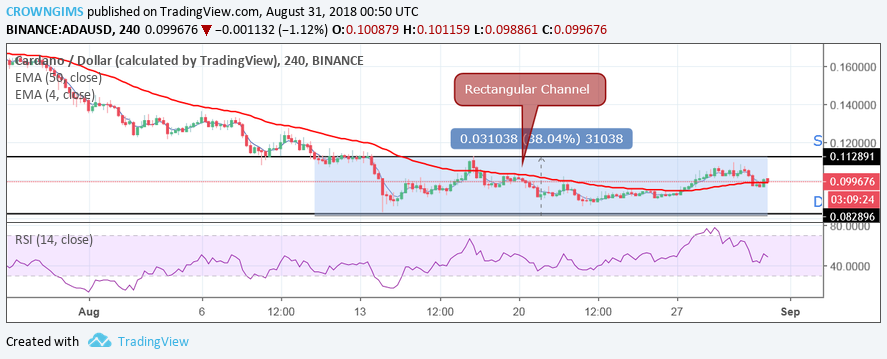
Traders should watch out for the breakout at the upper supply zone or break down at lower demand zone to occur before taking a position.
next