
The bulls may push the Cardano price up to the range of $0.052 and $0.058 if the daily bullish candle closes above the price level of $0.042
Key Highlights:
- The double bottom pattern formed on 4-Hour chart;
- the bulls may take over Cardano market;
- bears may lose control over ADA market.
ADA/USD Price Long-term Trend: Bearish
Supply Zones: $0.042, $0.052, $0.058
Demand Zones: $0.032, $0.030, $0.027
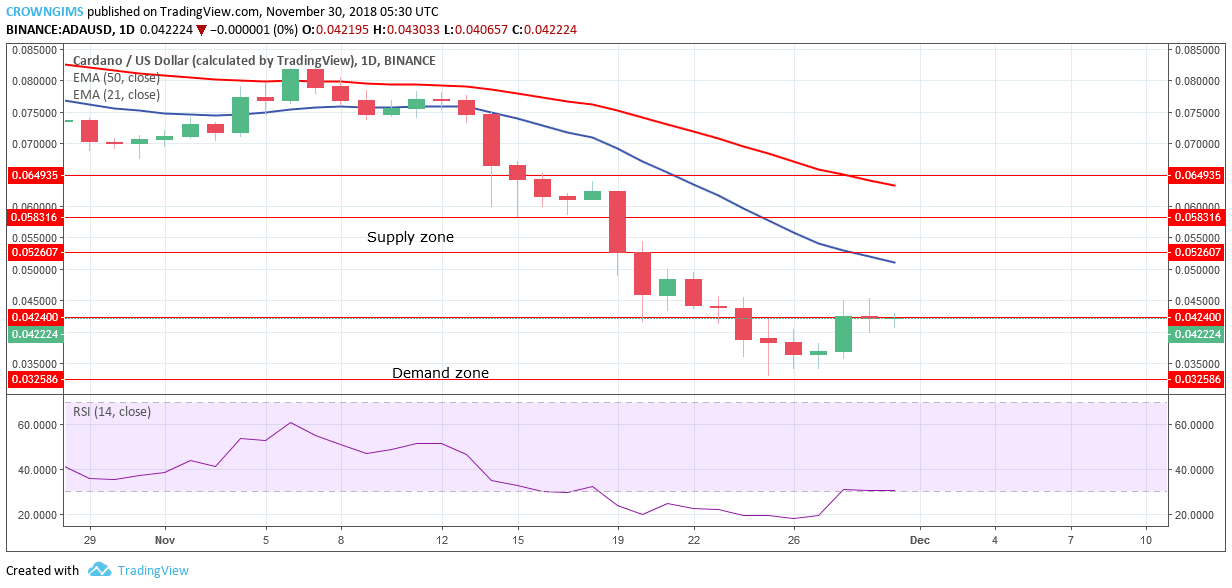

There was a rejection of further decrease of ADA price at the demand zone of $0.032 as a strong bullish candle formed to push ADA price up to the broken level of $0.042 which could be price retracement.
The cryptocurrency is on the bearish trend as long as it is trading below 21-day EMA and the 50-day EMA as it can be seen on the chart. Currently, Cardano price is on the supply zone of $0.042 forming Doji candles (consolidating).
The Relative Strength Index (RSI) is at the 30 level which is parallel on the level without showing any direction indicates consolidation is ongoing. If the daily bullish candle closes above the price level of $0.042, the bulls may push the price up to the range of $0.052 and $0.058.
ADA/USD Price Medium-term Trend: Ranging
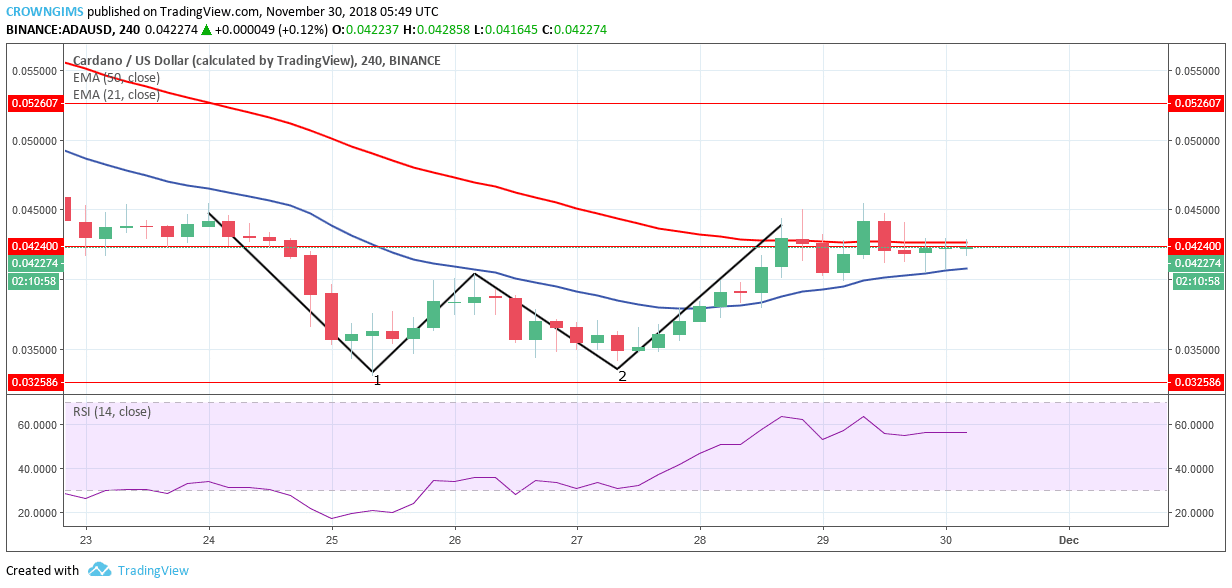
ADA price is trading in between the 21-day EMA and 50-day EMA, as an evidence of consolidation the Relative Strength Index period 14 is below 60 levels parallel to the level without any direction.
Should the bears increase their momentum and form a daily bearish candle that closes below the price level of $0.042, Cardano price will resume its bearish trend which may have the price level of $0.032 – $0.030 as its target.
next