
Little by little but cryptocurrencies started breaking their respective Triangle patterns.
Dmitriy Gurkovskiy, a senior analyst at foreign exchange broker RoboForex, provides his vision of the possible tendencies in price changes for Bitcoin as well as for other major cryptos.
Some of them have already fixed below downside borders, thus indicating strong bearish pressure and a potential decline in the nearest future. Even Ethereum, which has demonstrated some valid growth recently, couldn’t resist and moved to test the support area, a breakout of which may indicate completion of the reversal pattern. In this case, the descending impulse may resume. BTC/USD is still testing the support level but there are chances to see a breakout of $8,600 and a strong decline with the target at $6,300. To prevent this, bulls must push the price past its local highs, thus canceling reversal patterns.
Bitcoin
As we can see in the daily chart, Bitcoin is still trading within the Triangle pattern not far from its downside border. There are chances to see a breakout of the support level and a further decline towards $7,425 while completing the pattern. To confirm this idea, the cryptocurrency must fix below $8,600. Another signal in favor of this scenario is a rebound from the resistance line at the RSI – as one can see, bulls haven’t been able to fix above it. However, this scenario may no longer be valid if the price breaks the pattern’s upside border and fixes above $10,100. In this case, the asset may complete the pattern in an upward direction and continue trading upwards to reach $11,900.

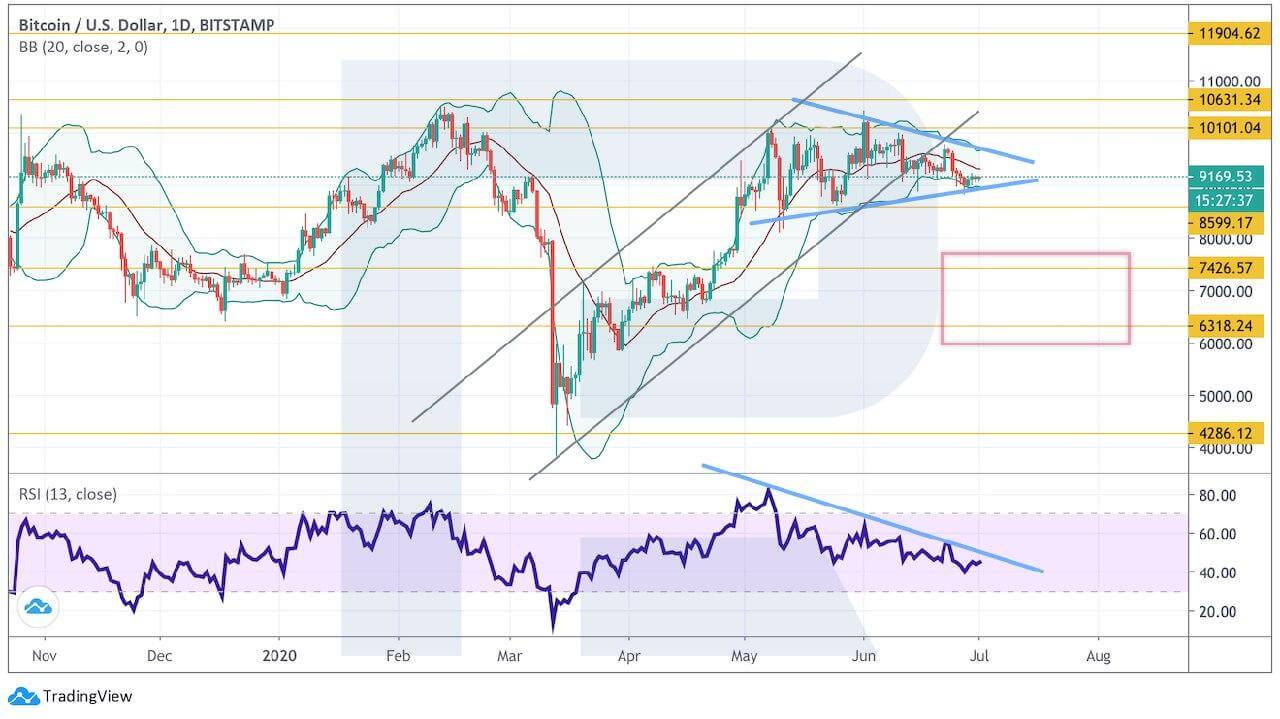
Photo: RoboForex / TradingView
In the H4 chart, Bitcoin is falling within the descending channel. There is a potential for a bullish correction to test $9,500. As one can see, the RSI may also face resistance from the trendline, which may result in another rebound and a further decline. To confirm this idea, the asset must break the support area and fix below $8,805. However, this scenario may be canceled if the price breaks the descending channel’s upside border and fixes above $9,850. In this case, the instrument may continue growing with the target at $10,215.
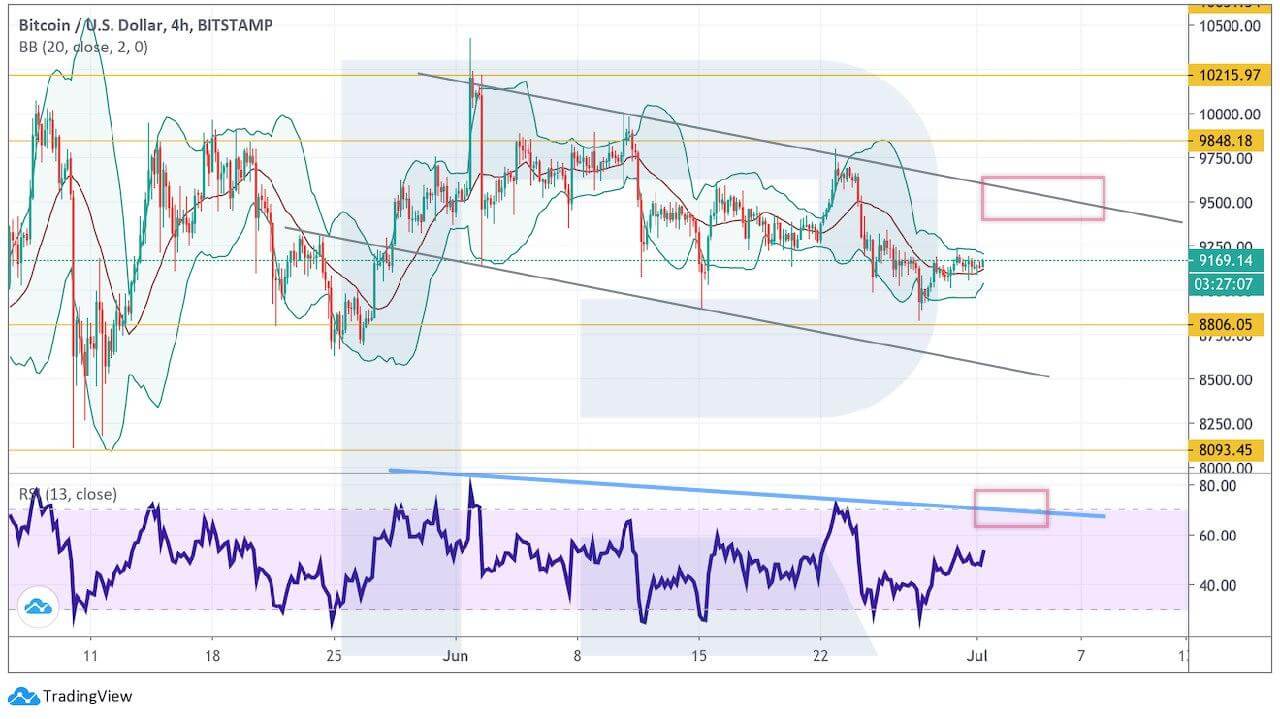
Photo: RoboForex / TradingView
Ethereum
In the daily chart, bears have finally managed to rebound from the descending channel’s upside border. Moreover, there has been a breakout of the ascending trendline, which is a strong signal in favor of a further decline. Still, one shouldn’t exclude another test of the channel’s upside border and a new descending movement with the target at $181. Another signal to confirm this idea will be a rebound from the resistance line at the RSI; the indicator is also unwilling to move any higher and the line has been preventing the price from growing for quite a long time. However, the bearish scenario may no longer be valid if the asset breaks the resistance area and fixes above $255. In this case, the instrument may break the channel’s upside border and continue trading upwards.

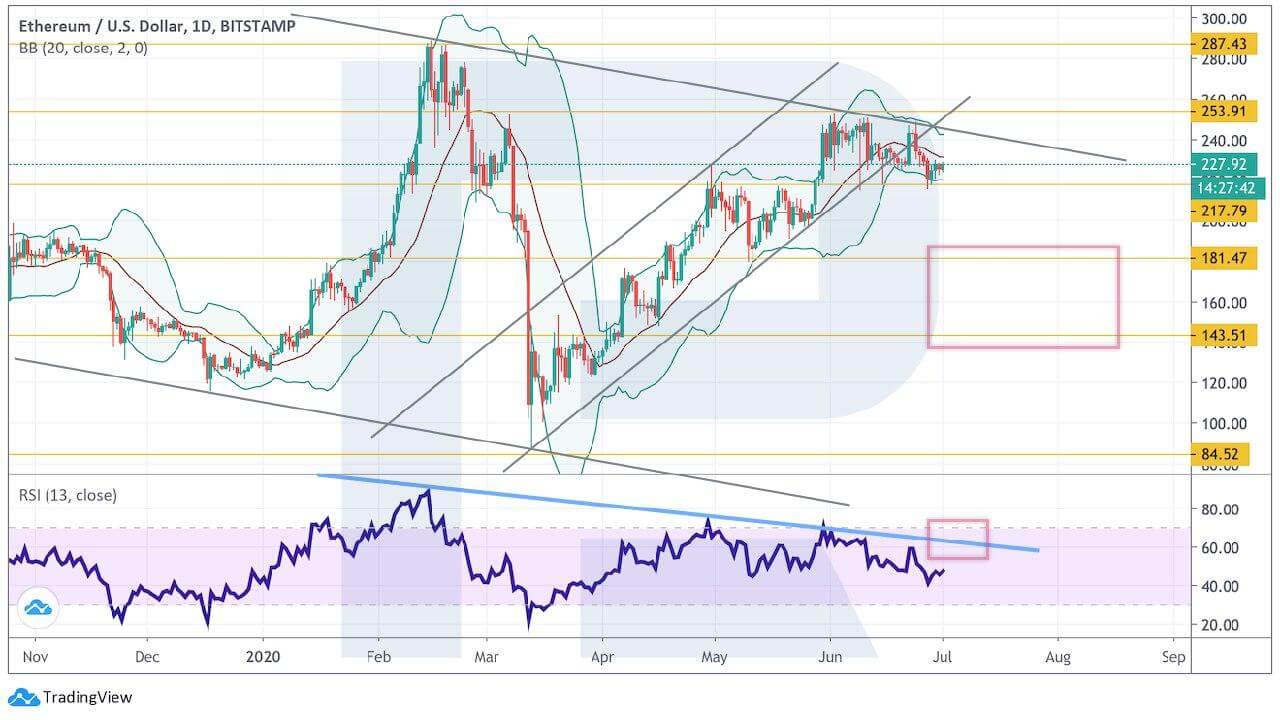
Photo: RoboForex / TradingView
On shorter timeframes, Ethereum has tested the rising channel’s downside border. There are risks of seeing further growth to test $237 before a new decline. To confirm this idea, the price must break the support area and fix below $218. After that, the instrument may break the channel’s downside border and fall towards $193. A strong signal in favor of this scenario will be a rebound from the resistance line at the RSI. However, if the asset grows and fixes above $240, the market may continue trading upwards to reach $253 and then $266.
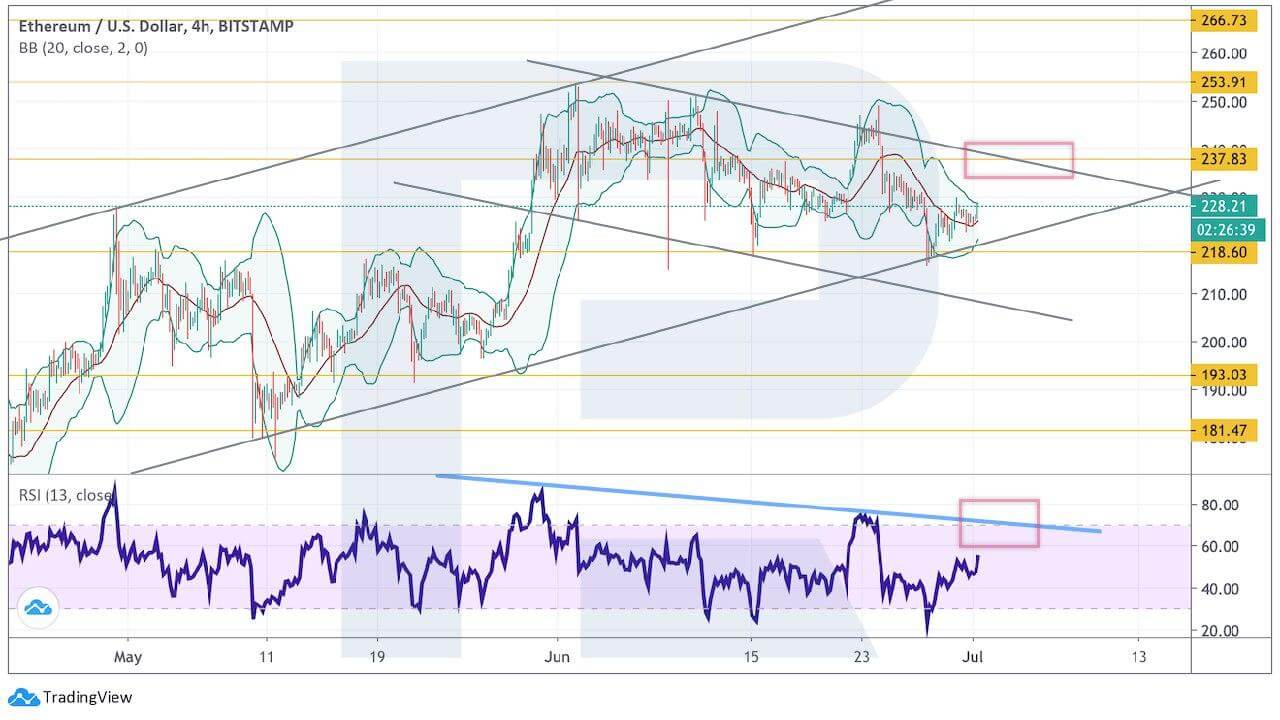
Photo: RoboForex / TradingView
Litecoin
As we can see in the daily chart, Litecoin is no longer moving inside the Triangle pattern but hasn’t been able to break the support area yet. One shouldn’t exclude the possibility that the cryptocurrency may re-test the pattern’s broken border and continue falling towards $23 while completing it. Another signal in favor of this idea will be a test of the resistance line at the RSI. However, this scenario may be canceled if the price breaks the resistance level and fixes above $51. In this case, the instrument may continue trading upwards.

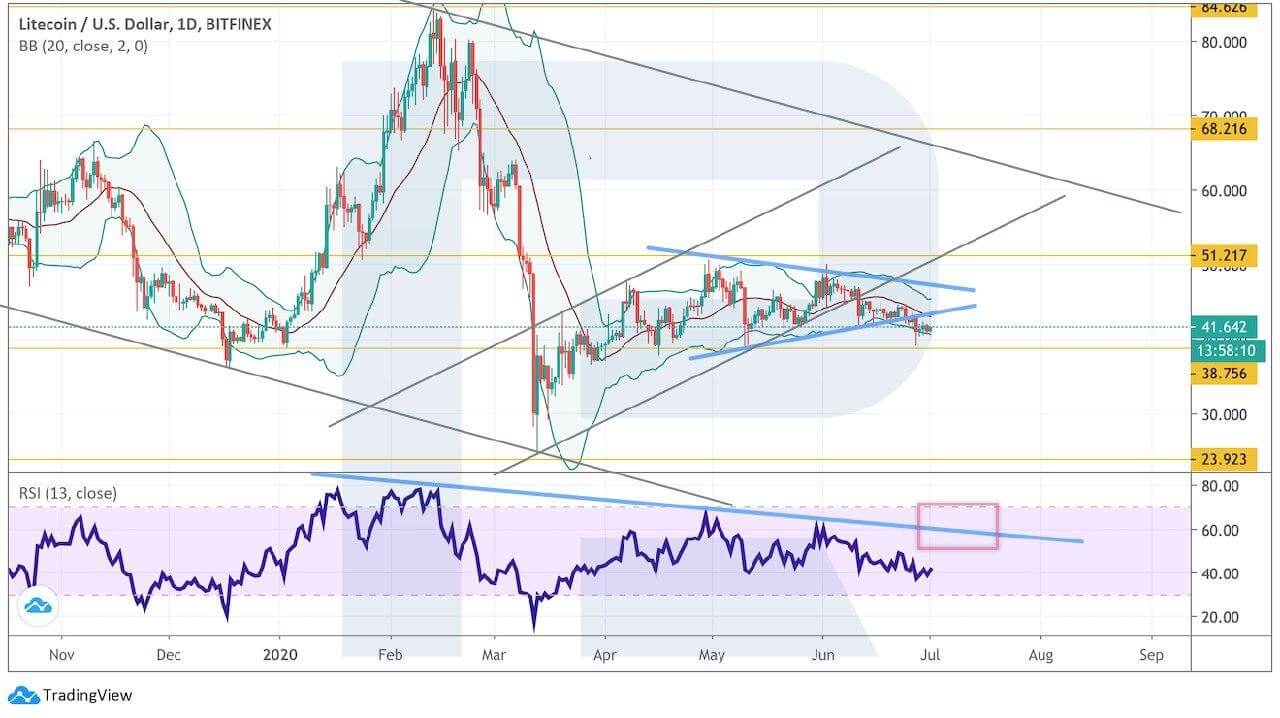
Photo: RoboForex / TradingView
In the H4 chart, LTC/USD is falling within the channel and forming a Head & Shoulders pattern. After breaking the support level and fixing below $40, the cryptocurrency is expected to continue falling towards $36 while completing the reversal pattern. One more signal in favor of this idea will be another rebound from the resistance line at the RSI. However, the bearish scenario may no longer be valid if the price breaks the channel’s upside border and fixes above $44. After that, the instrument may continue growing with the target at $48.
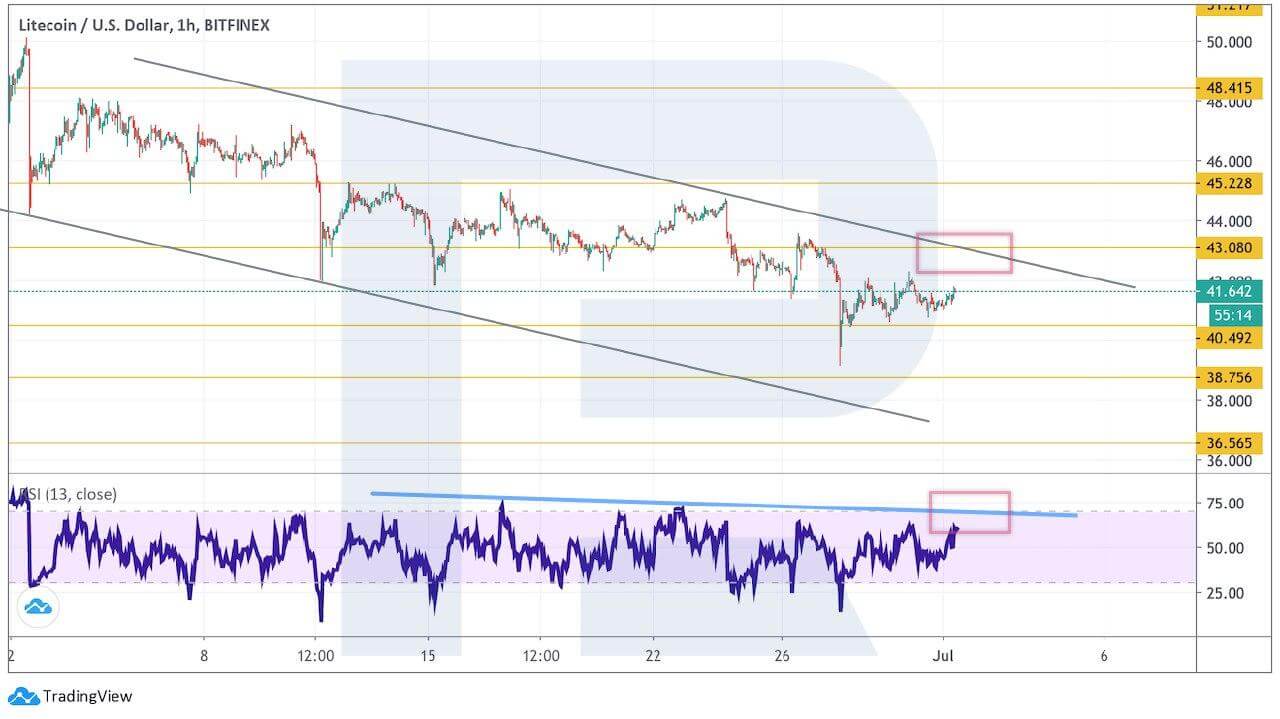
Photo: RoboForex / TradingView
Bitcoin Cash
Bitcoin Cash has been able to fix below the downside border of a Triangle pattern, thus indicating some strong bearish pressure. To confirm a further decline and the start of a pattern materialization, the asset must break the support level and fix below $202. In this case, the next downside target will be at $136. One more signal in favor of this idea will be a rebound from the resistance line at the RSI; as one can see, the line has been pretty strong resistance for bulls for quite a long time. However, this scenario may no longer be valid if the asset fixes above $280. After that, the instrument may continue trading upwards to reach $355.
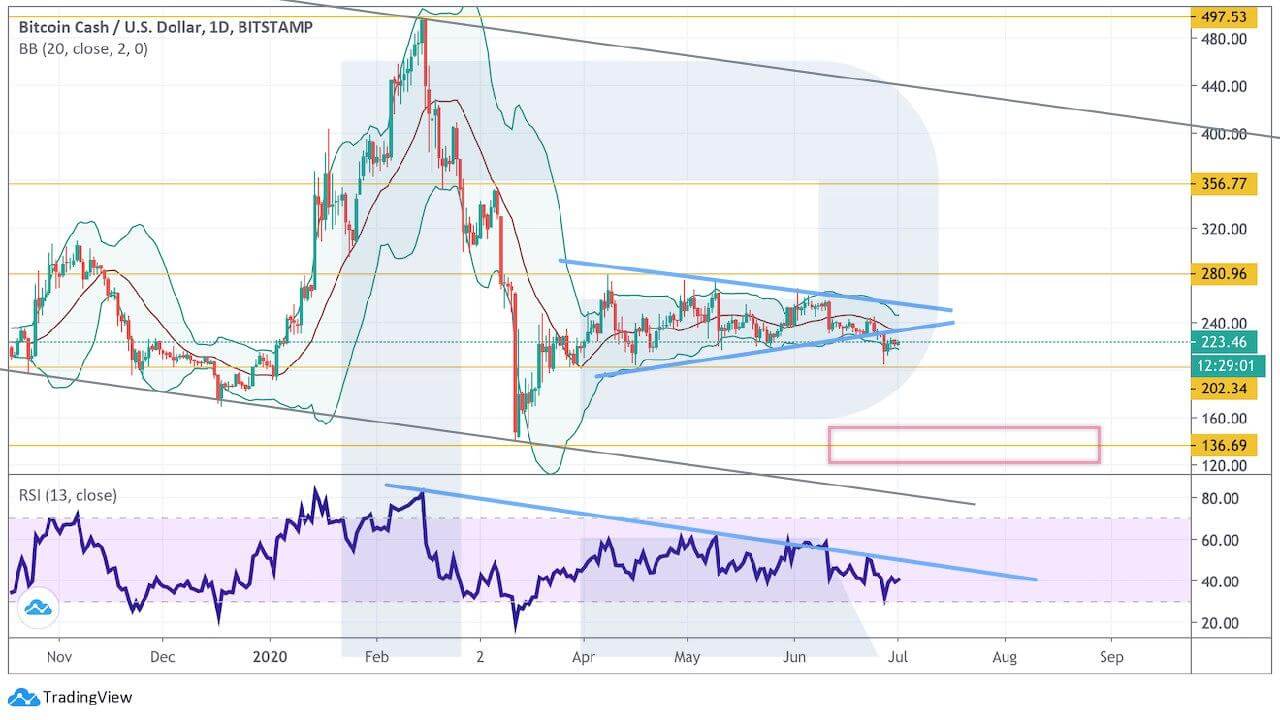
Photo: RoboForex / TradingView
As we can see in the H4 chart, the cryptocurrency is still moving under the resistance level. There are chances to see a further decline with the first target at $185. A strong signal in favor of this idea is a formation of a Head & Shoulders reversal pattern on the price chart and a possible rebound from the resistance line at the RSI. However, if bulls manage to push the instrument past $232, the asset may continue its ascending movement towards $270.
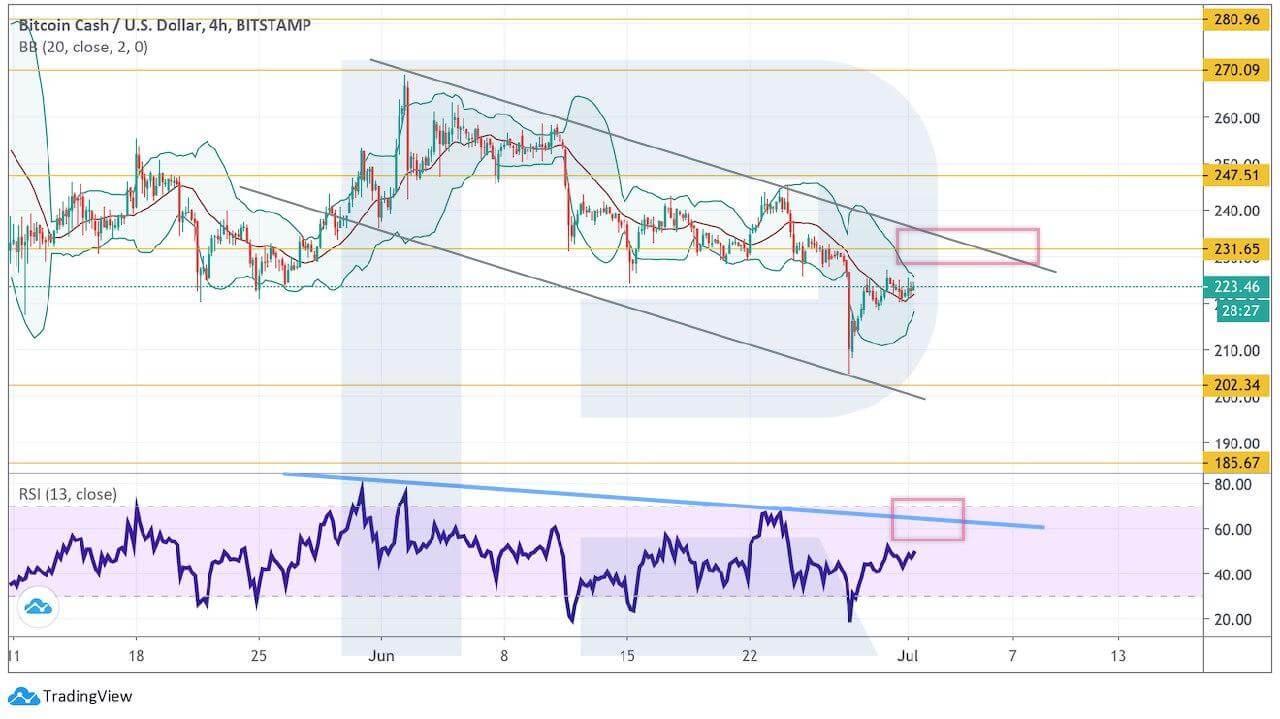
Photo: RoboForex / TradingView
XRP
As we can see in the daily chart, XRP is moving below the neckline of a Head & Shoulders reversal pattern. There are chances to see a further decline and a pattern materialization. The downside target is at $0.1085. However, one shouldn’t exclude a test of the broken lien before a further decline. In addition to that, the asset is trading below the Ichimoku Kinko Hyo Cloud to confirm a resumption of a bearish tendency. however, this scenario may no longer be valid if the price breaks $0.2175. in this case, the instrument may continue trading upwards to reach $0.2395 or even higher.
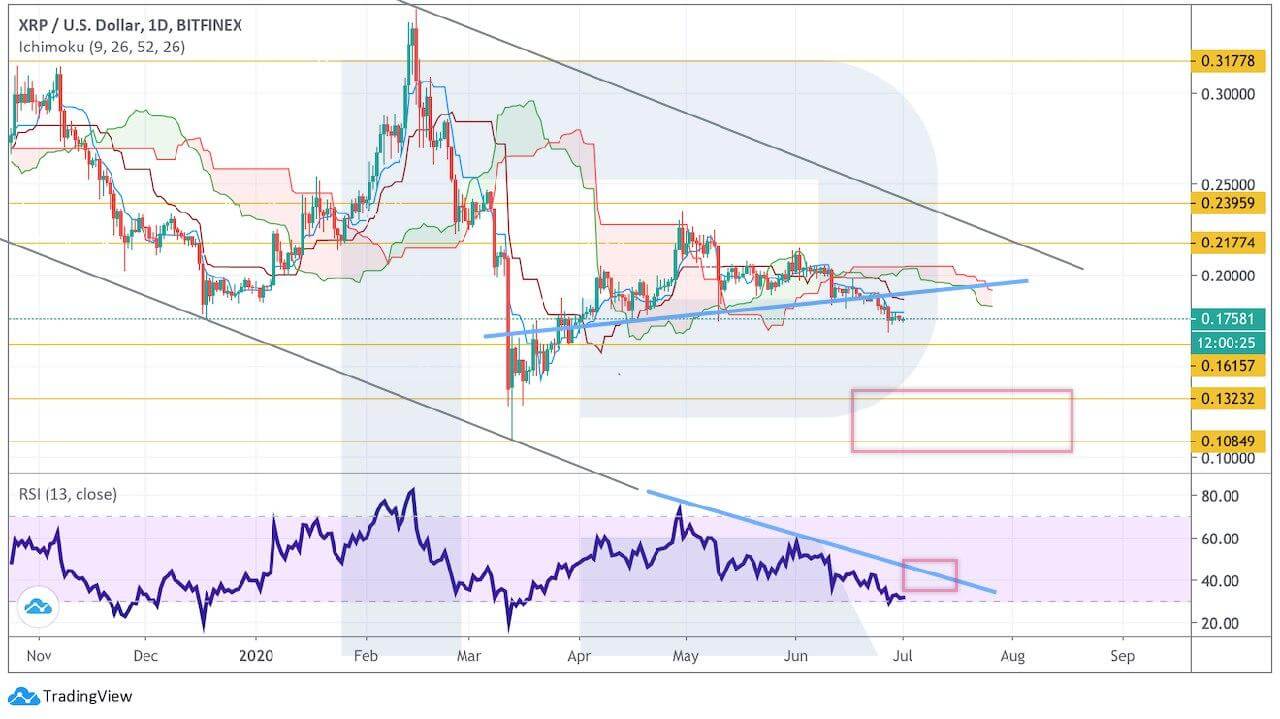
Photo: RoboForex / TradingView
On shorter timeframes, there is a descending impulse. The cryptocurrency is falling within the channel and there is a potential for a further decline with the target at $0.1690. if later the price breaks this level, the market may continue trading downwards to reach $0.1570. Another signal to confirm this scenario will be a rebound from the resistance line at the RSI – it already happened earlier. However, the bearish scenario may be canceled if the asset breaks $0.1905. After that, the instrument may resume its short term rising impulse towards $0.1970 or even $0.2160.
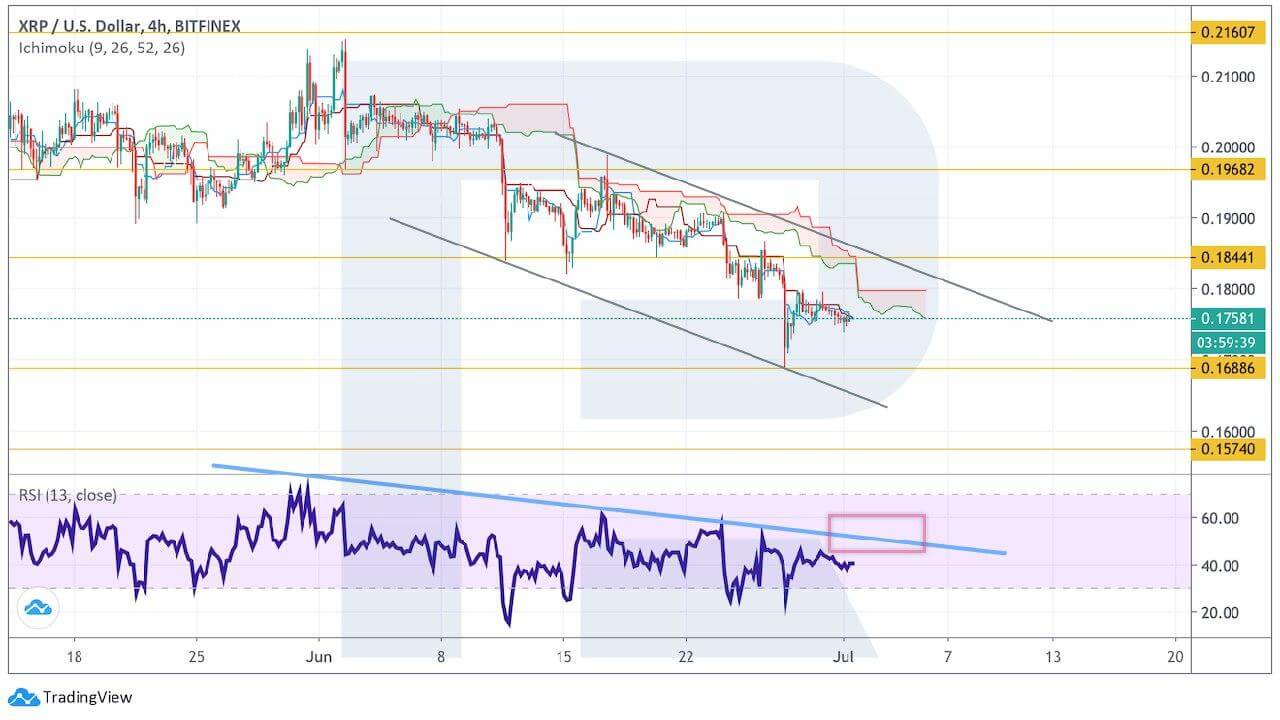
Photo: RoboForex / TradingView