
The price has formed an “ascending triangle” pattern on the daily and 4-hour chart which suggests the probability for the price increase toward a resistance level of $6.8.
Key Highlights:
- Formation of “Ascending triangle” pattern confirmed on the daily and 4H chart;
- the price might go up this week;
- traders should take a position with discipline.
EOS/USD Long-term Trend: Bullish
Resistance levels: $6.8, $9.4, $11.4
Support levels: $4.1, $2.0, $0.5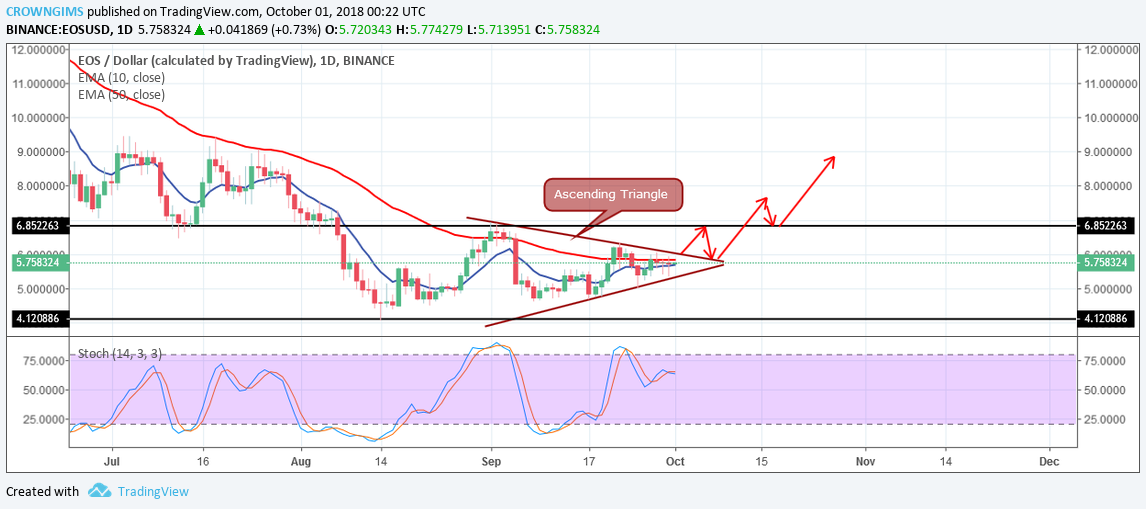

On the daily chart, the Stochastic Oscillator Period 14 is above the level 50, with its signal lines pointing towards north, which indicates there could be a bullish movement this week towards the resistance level of $6.8 immediately it breaks out from the ascending triangle. Nonetheless, there may be a downward movement towards the support level of $4.1 in case the bears increase their momentum.
EOS/USD Price Medium-term Trend: Bullish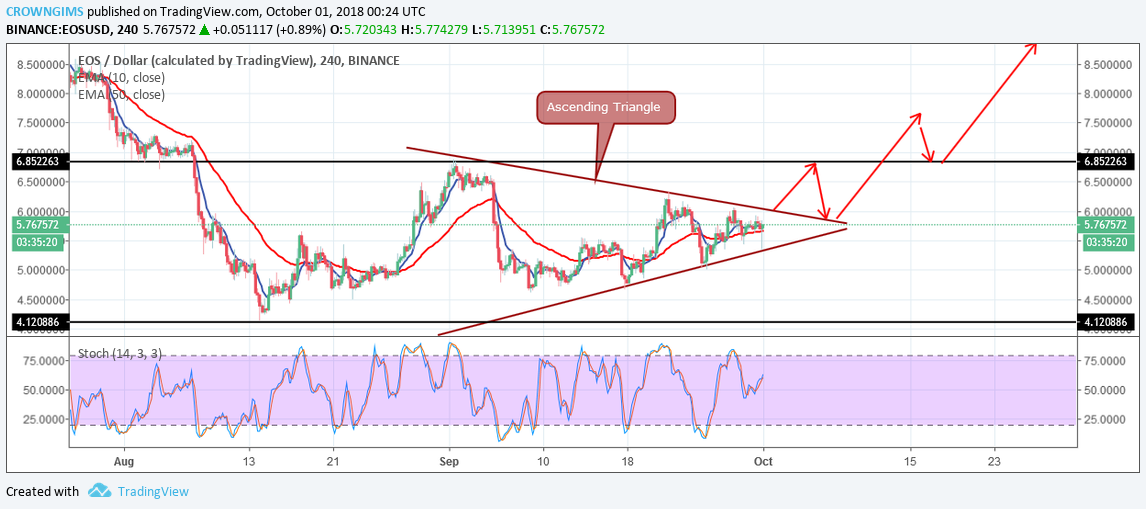
EOS/USD is bullish on the medium-term outlook, due to the ascending triangle formed within the channel last week. The price has been moving upward with the formation of more bullish candles. As of this week, the price may move higher by break out at the upper trend line of the ascending triangle.
The 10-day EMA has crossed the 50-day EMA upward with the price above the 10-day EMA, confirming the uptrend. Should EOS price go up to the resistance level at $6.8 and produce a bullish pattern, then further upward movement could be anticipated. Traders are advised to be disciplined before taking a position.
next