
In case the historical Ethereum price level of $140 hold, traders can initiate buy setups in anticipation for bullish trend.
Key Highlights:
- The bears were in control over the Ethereum market;
- the downtrend may continue;
- the ETH price may change to an uptrend.
ETH/USD Long-term Trend: Bearish
Supply levels: $166, $190, $225
Demand levels: $140, $115, $102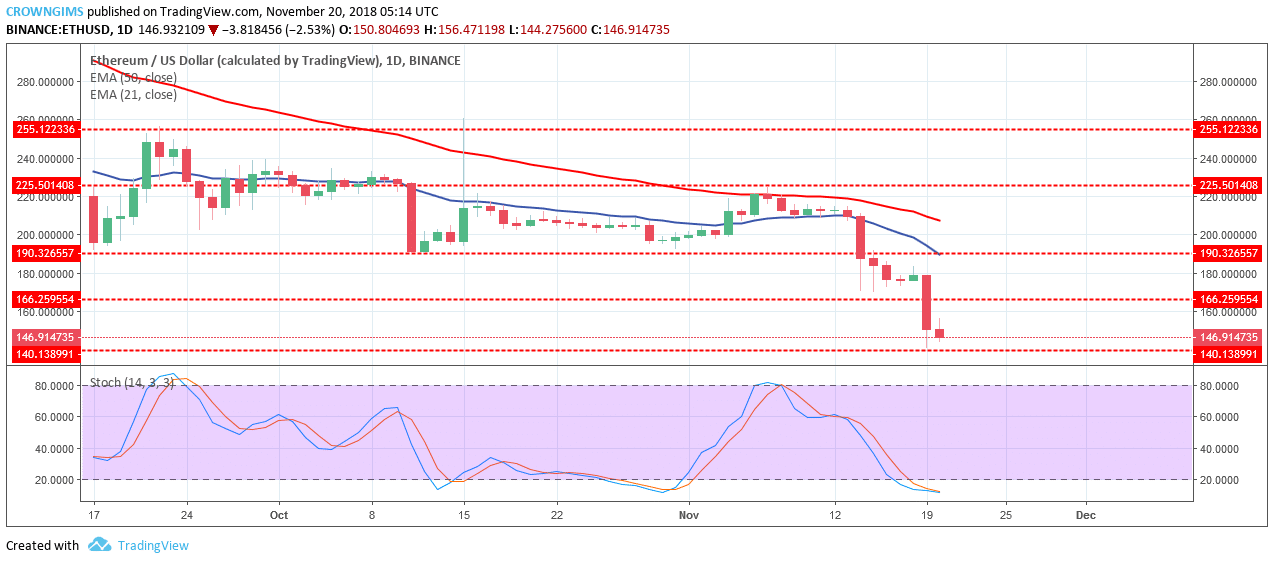

This week Ethereum price may respect that historical price level. In other words, $140 price level may likely hold. In case of this level hold, traders can initiate buy setups in anticipation for bullish trend. ETH price is below the 21-day EMA and 50-day EMA with the two EMAs well separated; which indicates that the bearish trend is ongoing.
The Stochastic Oscillator period 14 is below 20 levels (oversold region) which indicate the preparation of the bulls to take over the market and change to an uptrend.
ETH/USD Medium-term Trend: Bearish
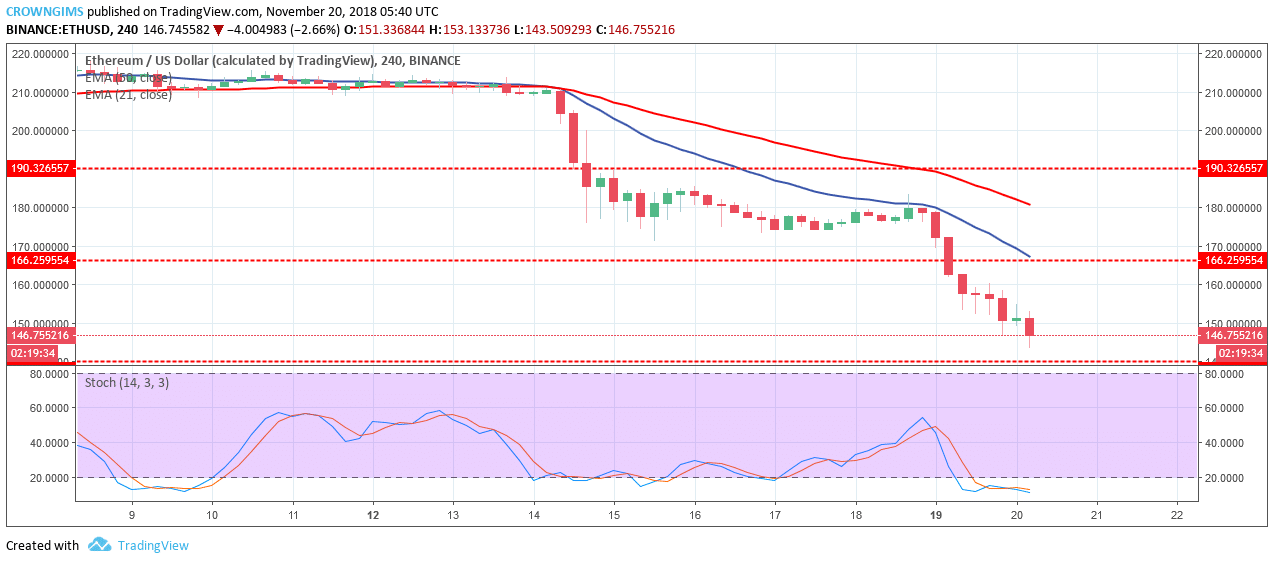
The ETH price is under 21-day EMA and 50-day EMA with the Stochastic Oscillator period 14 below 20 levels with the signal lines point to the south indicate a sell signal at the oversold zone. In case the demand level of $140 is broken by the bears, ETH will target the demand level of $115.
next