
In case the Bulls do not lose their momentum and the $178 level does not hold, Ethereum price may reach the previous high of $186 level. Should the Bears defend $178 level, the price may be pushed down to $167 level.
Key Highlights:
- The Bulls may take over the Ethereum market soon;
- price retracement is inevitable;
- the price may to $186 level in case $178 level do not hold.
ETH/USD Medium-term Trend: Bullish
Supply Zones: $178, $186, $194
Demand Zones: $167, $158, $147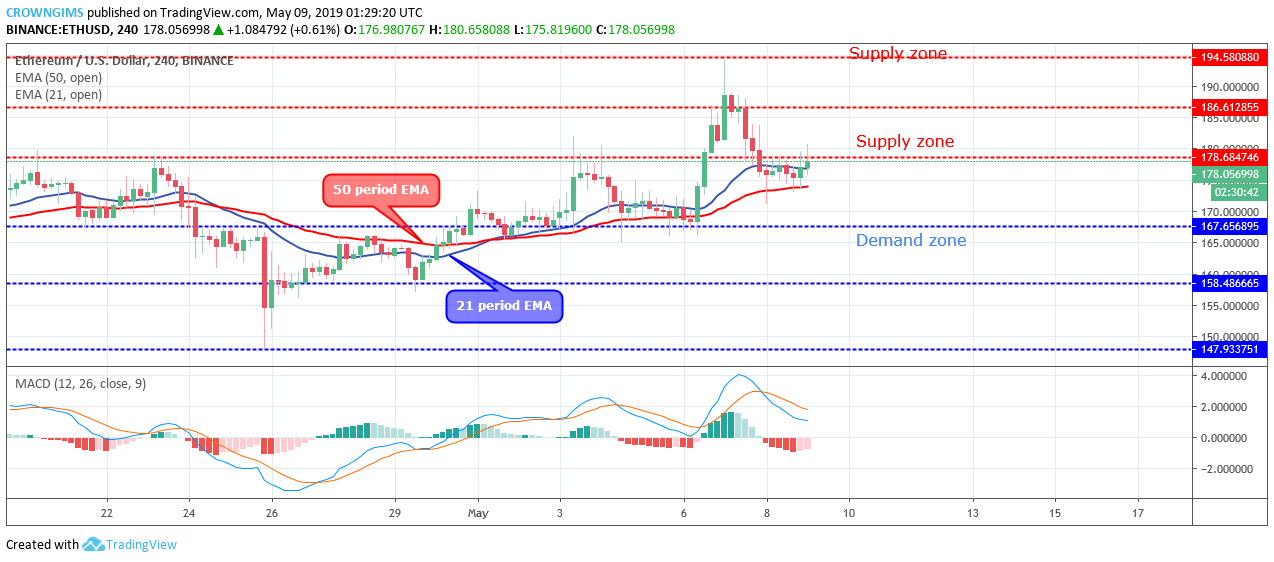

The Bulls’ momentum failed and the Bears took over with increased momentum and the price returned to $179 on May 07. On May 08, the price consolidated below $179 level throughout the whole day. Today, on the 4-hour chart, the market opened with a bullish candle that is breaking up the $178 level as at the time of writing this report.
Ethereum price is currently trading above the 21 periods EMAs and 50 periods which indicate that the Bulls are returning into the Ethereum market. The Moving Average Convergence Divergence period 12 is coming up to the level above zero with its signal lines pointing up to indicate a buy signal.
In case the Bulls do not lose their momentum and the $178 level does not hold, Ethereum price may reach the previous high of $186 level. Should the Bears defend $178 level, the coin may be pushed down to $167 level.
ETH/USD Short-term Trend: Bearish
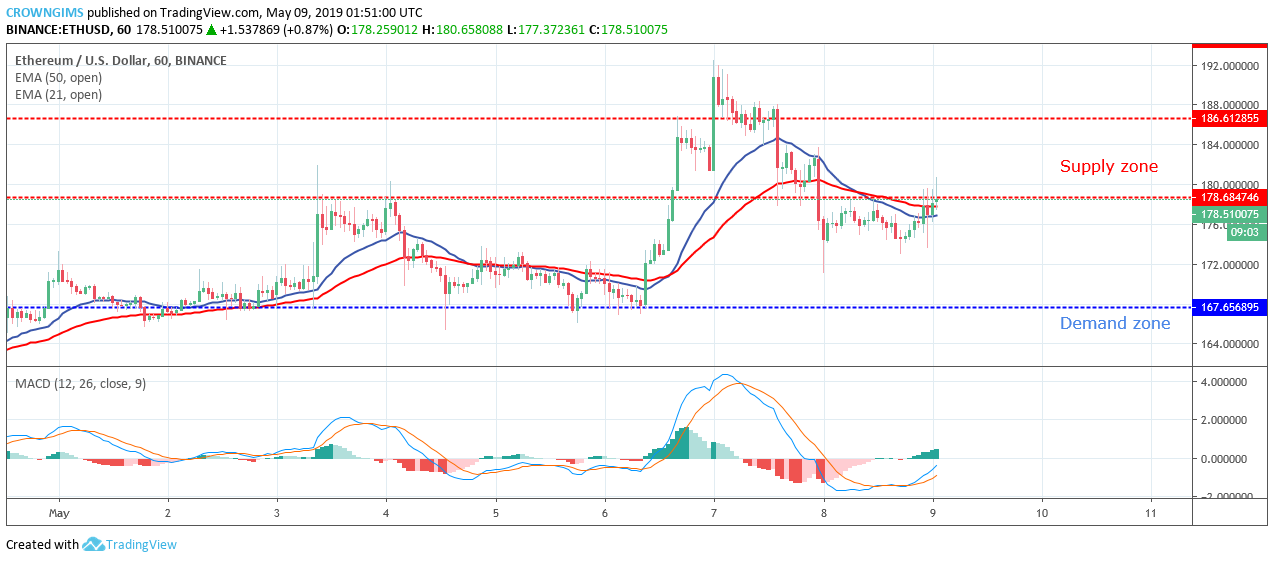
The crypto is currently trading over the two EMAs while 50 periods EMA is above the 21 periods EMA. The MACD period 12 and its histogram are above zero levels and the signal lines bending up to indicate buy signal and an increase in the Bulls momentum.
next