Ethereum Price Analysis: ETH/USD Price May Reach $289 Level

On Jun 18, 2019 at 12:47 pm UTC by · 2 min read

Should the Bears continue to exert pressure as it is currently displaying, Ethereum price may retest $258 demand level. The interruption of the Bulls to the Bearish current movement will push up the price to reach $289 level.

Key Highlights:

  • The Bullish momentum is getting weak;
  • Ethereum price is ranging on the 1-hour chart;
  • the Bears may take over.

ETH/USD Medium-term Trend: Bullish

Supply Zones: $289, $318, $351
Demand Zones: $258, $225, $191Ethereum is bullish on the medium-term outlook. The coin broke out at $358 level on June 12. The retracement was carried out. On June 14, the bullish momentum resumed and Ethereum price was pushed up steadily by the Bulls. On June 16, there was a pullback on the 4-hour chart towards the dynamic support and resistance level. Today, the market opened with bearish candles which indicate that the Bears want to dominate the market.

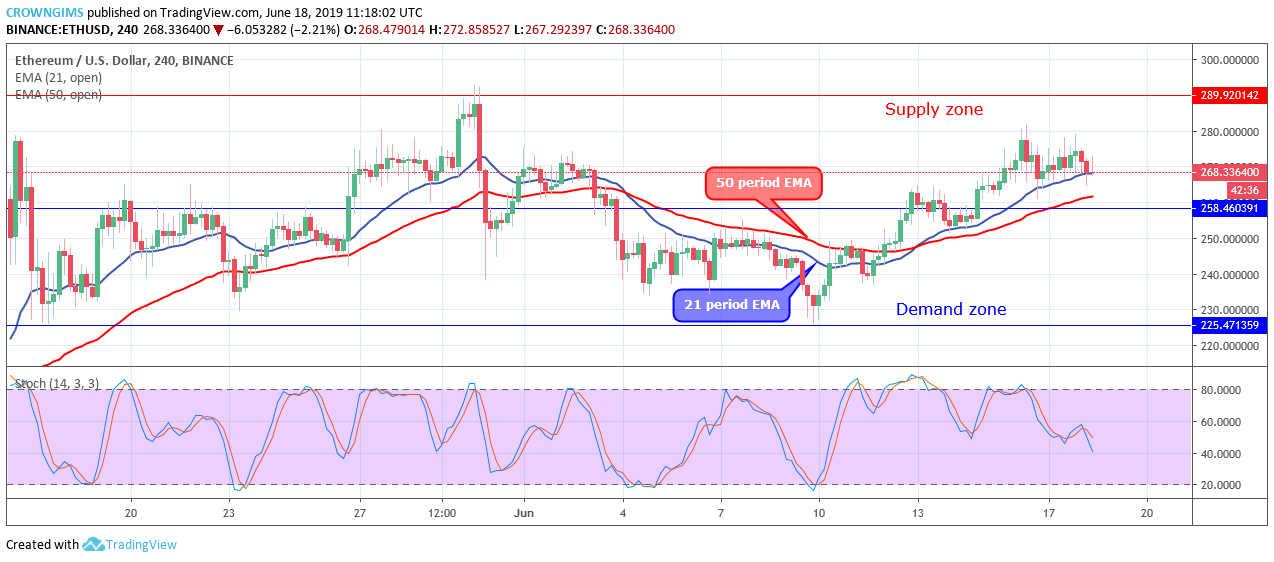
The two EMAs are following the trend upward and the crypto is trading above the 21 periods EMA and 50 periods EMA with the 21 EMA above the 50 EMA which connotes strong bullish trend in the market of Ethereum. The Stochastic Oscillator period 14 is at 40 levels with the signal lines pointing down to indicate sell signal and reduction in Ethereum price which may be a pullback.

Should the Bears continue to exert pressure as it is currently displaying, the Ethereum price may retest $258 demand level. The interruption of the Bulls to the Bearish current movement will push up the price to reach $289 level.

ETH/USD Short-term Trend: Bullish

ETH price is bullish on the short-term outlook. After the breakout at the former supply level of $258, the price is making higher highs movement towards the $289 level. On June 16, there was a sudden drop in price by the Bears’ pressure. Ethereum price decreased to reach the $258 level but supported at the 50 periods EMA level. Then a sideways movement began at the dynamic support and resistance level.

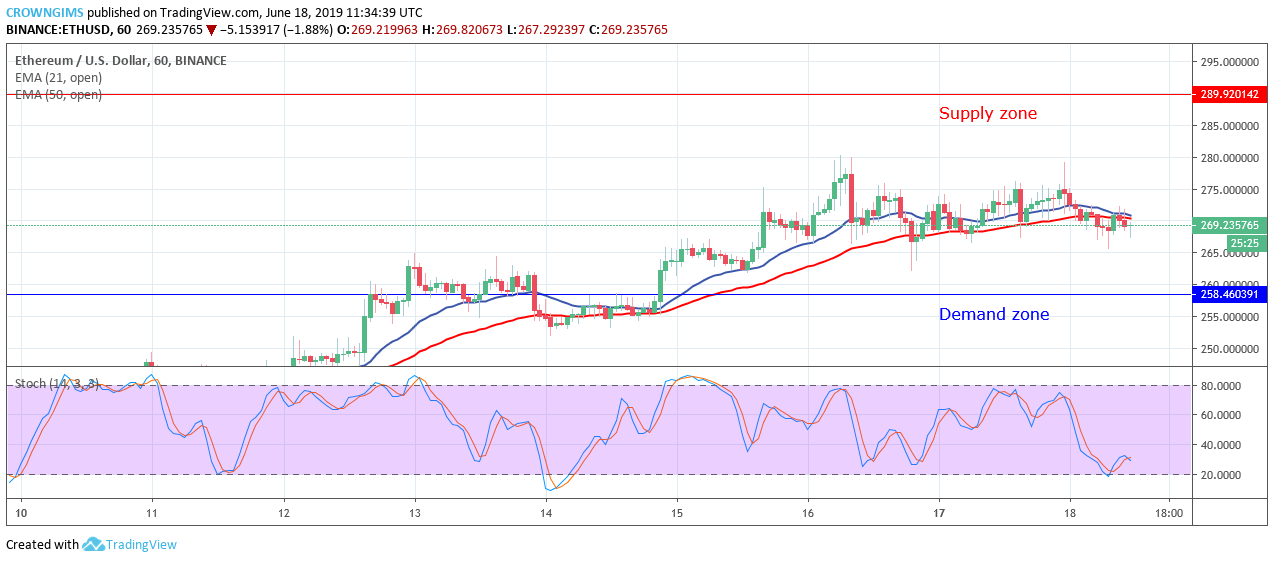
The coin is currently ranging on the 21 periods EMA and 50 periods EMA. The coin is making an attempt to cross the two EMAs downside. Meanwhile, the Stochastic Oscillator period 14 is at above 50 levels and the signal lines bending down to indicate sell signal.

Share:

Related Articles

BlockDAG Expands Payment Options with 10 New Cryptos, Surpassing Ethereum’s Price Predictions and XRP Whales’ Activity

By May 7th, 2024

Explore BlockDAG’s innovative new payment options, Ethereum Price Prediction, and XRP whales’ recent updates.

Poloniex Hacker Transfers Several 1100 ETH to Tornado Cash

By May 7th, 2024

The Poloniex hacker has different crypto assets, led by Ethereum (ETH) and Tron (TRX), worth more than $181 million.

SEC Delays Decision on Galaxy Spot Ethereum ETF, ETH Price Dips 3%

By May 7th, 2024

The optimism surrounding the approval of spot Ethereum ETF by the end of May has dropped from 70% to now at 25%.

Exit mobile version