
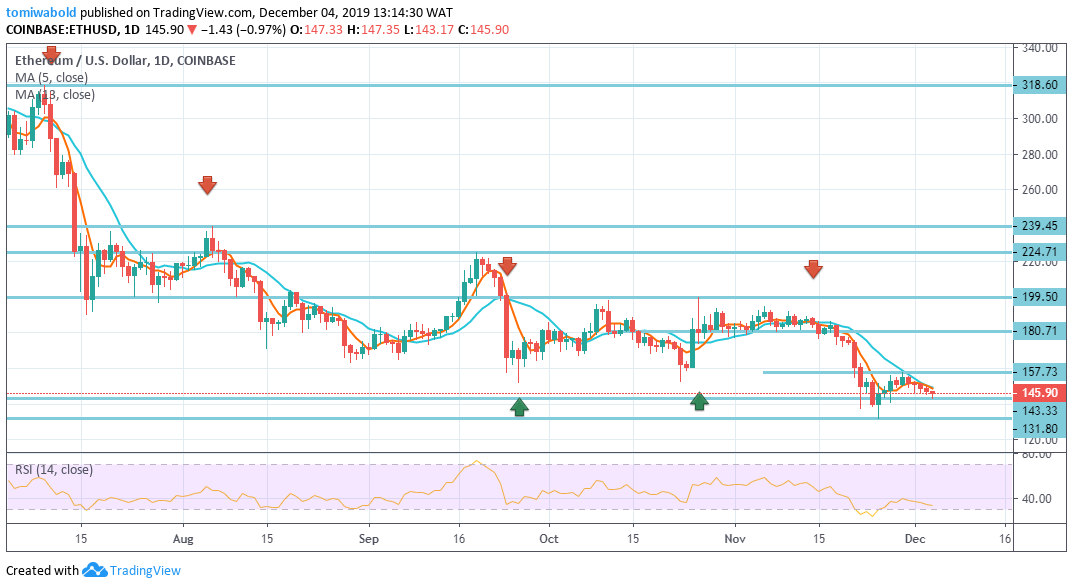
Ethereum price continues to consolidate within a narrow trading range between the level at $143.33 and $157.73.
The Ethereum project ETH token kept on sliding during the last exchanging session of the earlier week and eradicated another 7.9 percent of its value. It was decreased to $139 shutting the seven days with a 24 percent loss.
The ETH/USD pair was very unstable on Monday, November 25 and was exchanging the $132-$152 zones. The bulls figured out how to abstain from breaking underneath the $130 handle and effectively raised the value to $145, including about 3.5 percent.
Next is on Tuesday, November 26, it rose to $147 on its second continuous day of growth.
Following is the third day of that week, which was the same since the fundamental altcoin kept on rising and came to $152 in the wake of arriving at a limit of $156 during the day.
While on Thursday, November 28, we saw a slight adjustment and a tumble to $150, directly in the center of the $152-$150 barrier zone reached as of Monday.
Also Friday, November 29, ETH moved north and effectively increased 2.6 percent. It exited at $154.5 after arriving at a limit of $158 during the intraday session.
The primary day of the end of the week started with another red light. We saw that Ether fell back to $151 on Saturday, November 30, since neither the bulls nor the bears could lead the pack. The month finished with a loss of about 17 percent.
On Sunday, December 1, the ETH/USD pair exchanged in the region of $146-$152, however, exited at $151. It grew by 7.2 percent on a weekly chart.
Right up ’til today, ETH has dropped beneath $145, which is its most reduced value since March, limiting the fall last Monday.

Bearish Momentum Dominates ETHUSD Dragging It Lower
Supply Levels: $143.33, $131.80, $120.00
Demand Levels: $199.50, $180.71, $157.73
ETH/USD has plunged from the level at $147.35 to $143.17 in the early hours of Wednesday and value is trending beneath the moving average 5 and 13. The horizontal lines are formed in parallel with each other as price stays below each level, indicating a sustained bearish momentum.
Longer-term monthly volatility is currently a little higher than usual for ETH/USD. Its price has continued to consolidate within a narrow trading range between the level at $143.33 and $157.73, where it has now been captured during the last five trading days.
The market again found sellers today around the moving average 5 and 13 for the fifth consecutive day after having found resistance earlier on the level at $157.73 on the 30th of November and on the level at $151.65 two days ago.
The outlook stays bearish, displaying an intact downtrend in the short, medium and long term.
next