
Hyperliquid has shattered records with $548 million in weekly inflows and a $5.6 billion open interest milestone, fueled by Hyperbridge launch.
On-chain data suggests that Hyperliquid HYPE $28.49 24h volatility: 4.1% Market cap: $6.79 B Vol. 24h: $288.87 M has recorded a massive $548 million in net asset inflows from May 5 to 11. On May 8 alone, the protocol attracted $200 million in inflows, the highest single-day increase in its history.
Hyperliquid also reported an all-time high open interest of $5.6 billion on May 11, underlining its dominance in decentralized derivatives trading.
Hyperliquid reached a new all-time high in open interest of >$5.6B. pic.twitter.com/x8A6f7RhHY
— Hyperliquid (@HyperliquidX) May 11, 2025
Popular crypto analyst McKenna noted that Hyperliquid has executed $2.5 to $3 million in buybacks in a single day under its Assistance Fund Buybacks program.
$2.5-3M buybacks on a single day. Biggest revenue generating protocol in the digital asset class and largest driver of value back to token holders.
Other teams that continue to bifurcate value across token and equity take notice.
Hyperliquid $HYPE pic.twitter.com/RB5MOqff4E
— McKenna (@Crypto_McKenna) May 12, 2025
This increase in activity comes amid the launch of Hyperbridge, a new tool built on Layerzero’s omnichain interoperability protocol. Hyperbridge allows seamless bridging of assets like USDT0 [NC], USDe USDe $1.00 24h volatility: 0.0% Market cap: $6.42 B Vol. 24h: $100.15 M , and PLUME from over 50 blockchains directly into Hyperliquid’s decentralized exchange.
Hyperbridge currently supports tokens such as COOK [NC], USR , and RLP , with open applications for new listings. The integration brings centralized-like efficiency to decentralized trading. It aligns with Hyperliquid’s vision of combining transparency with high-performance trading experiences.
Hyperliquid’s devs describe the rollout as a key milestone in connecting its ecosystem to the wider crypto economy.
HYPE Price Outlook
Amid the ongoing ecosystem growth, HYPE is trading around $25, gaining 4% in the past 24 hours. After falling to $9.20 on April 7, the 19th largest cryptocurrency has rebounded 57% in the past month. During this time, it added $3.37 billion to its market cap.
On the daily HYPE price chart, the RSI sits just below the overbought region, suggesting strong momentum. However, investors must keep an eye on potential exhaustion, especially around the strong resistance at $26.

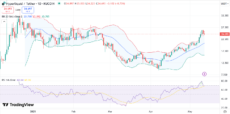
HYPE price chart with RSI and Bollinger Bands | Source: Trading View
Meanwhile, the price is riding the upper Bollinger Band, a classic sign of strength but also a potential reversal point. If the price fails to hold this level and drops to mid-band (20-day SMA) at $22.10, traders could see some consolidation in the short-term.
The MACD indicator remains in bullish territory with the MACD line above the signal line, showing continued upward momentum. A decisive breakout above $27.50 could lead the token to $30+.

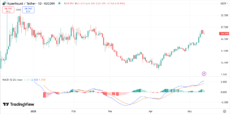
HYPE price chart with MACD | Source: Trading View