
XMR continues its downward trending after breaking of $130 distribution level, the pair will experience further downward movement and get exposed to another strong accumulation level at $55.
Key Highlights
- There is a Bearish Confimation Pattern in the Monero daily chart;
- the more the price goes donwwards, the higher the probability of a strong rally, which may happen anytime;
- traders are advised to speculate only on what they see.
XMRUSD Long-term Trend: Bearish
Resistance levels: $110, $120, $130
Support levels: $70, $60, $50
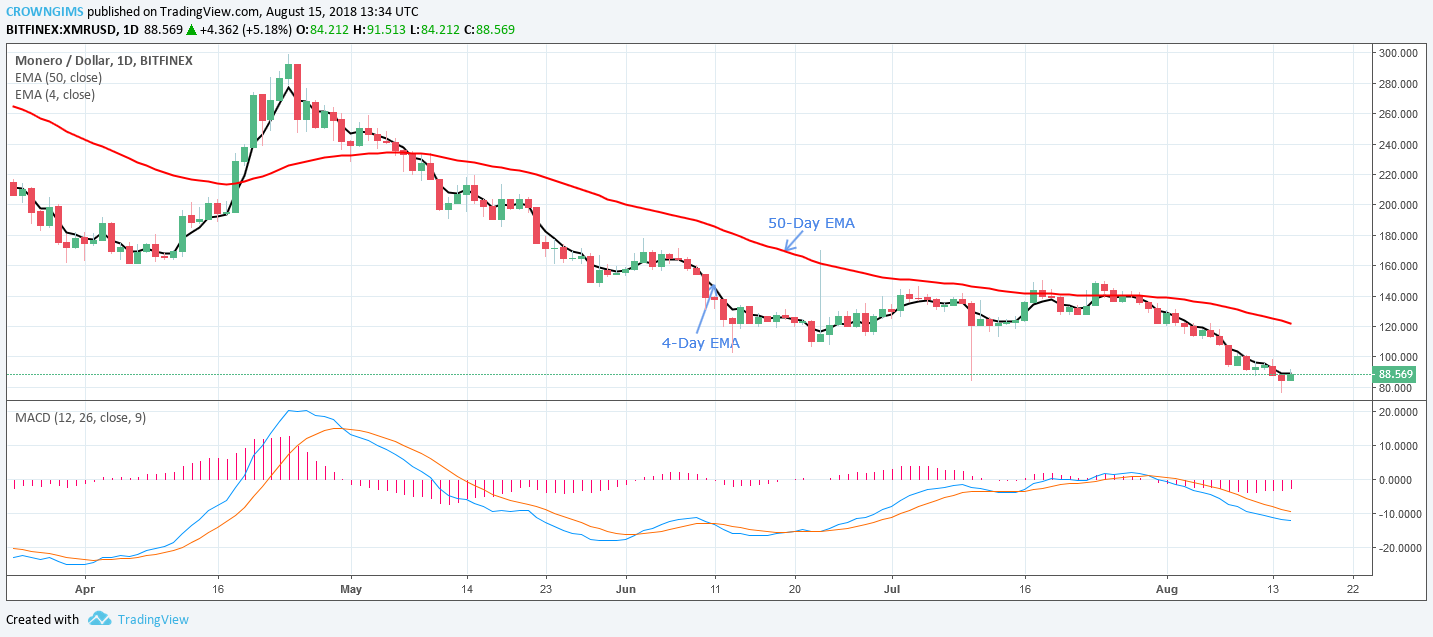

XMR continues its downwards trending after breaking of $130 distribution level. The southwards movement started after consolidation for one week and the 4-day EMA crossed the 50-day EMA downward. Sellers are putting more pressure on the pair, and the price is sliding further downwards. The price is moving away from the 50-day EMA on the Daily chart, which indicates a downwards trend continuation.
Minor Accumulation level of $70 has been tested by the coin, and a bullish retracement is possible (which is supposed to be temporary). The cryptocurrency is presently exposed to the strong accumulation level of $70. Should the strong accumulation level get broken, the pair will experience further downward movement and get exposed to another strong accumulation level at $50. The MACD, with its histogram below the zero level, and the signal lines pointing downwards, indicates that the price may still move down.
XMRUSD Price Medium-term Trend: Bearish
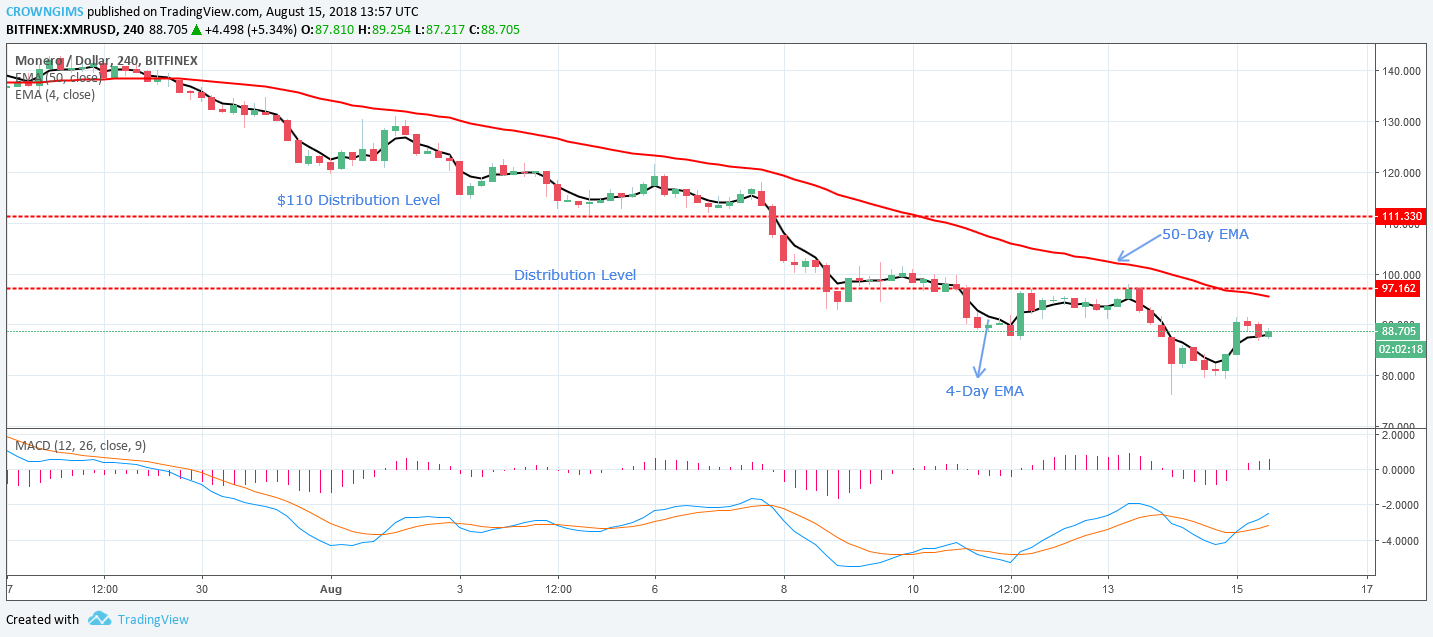
On the 4-Hour chart, Monero formed another consolidation near the $90 price level, last week. After which the price broke the level and bearish journey resumed. A minor accumulation level of $70 was tested and price pulled back to $80, and made retracement to $90. In case retracement continues and the market breaks the distribution level of $110, then an upward movement is possible. The price may resume its bearish movement, should the accumulation level of $70 is broken.
The MACD in the 4-hour chart shows that taking long trade may be logical, as the histogram on MACD is above the 0-level (positive area) and the signal lines are pointing upward.
next