Solana opened Monday at $135, down 20% from its June 12 peak of $163. However, network transaction throughput remains strong at 3,796 TPS, suggesting underlying demand persists despite the price decline.
Solana price opened trading below $135 on Monday, June 23, down 20% from the monthly timeframe peak recorded on June 12. Despite the sharp pullback, key technical and network usage metrics show growing signs of a local rebound forming.
Solana Holds Network Strength Despite 20% Price Pullback
Solana SOL $90.31 24h volatility: 1.3% Market cap: $51.69 B Vol. 24h: $4.02 B price briefly fell to $130 this week, yet the network’s transaction throughput remained steady. On-chain data from Solscan shows that Solana is currently processing 3,796 transactions per second (TPS), only a 13% decline from its June 12 peak of 4,370 TPS.

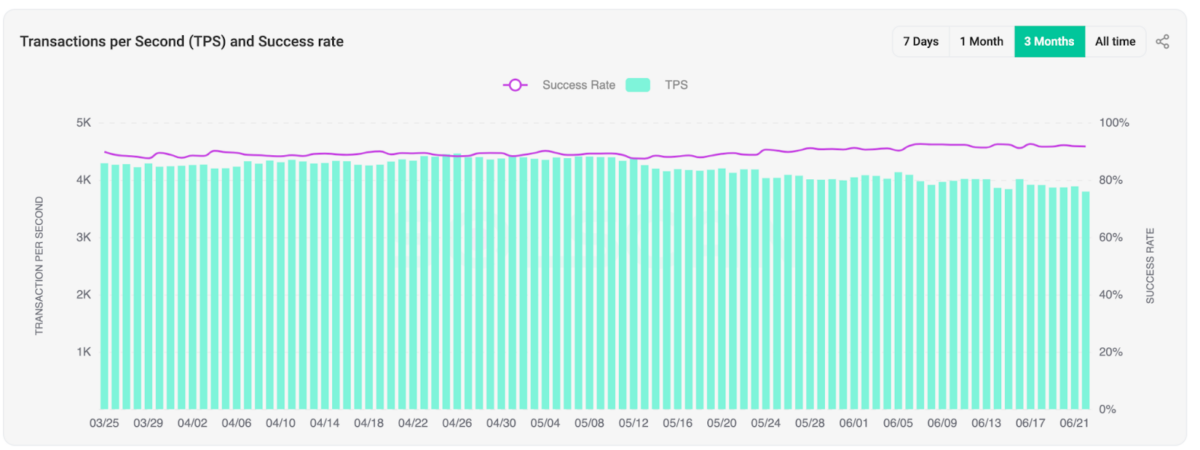
Solana Transactions Per Seconds | June 2025 | Source: Solscan.io
This data points to a robust underlying demand for blockspace on the Solana network, even as prices dropped 20% from $163 at the onset of the current downswing on June 12, to hit $133 on Monday June 23. When such divergences between price and network activity occur, it often signals undervaluation. With usage levels still healthy and the SOL token oversold relative to its network fundamentals, a bounce toward fair value could materialize if market sentiment stabilizes.
Solana Price Prediction: Bullish Reversal in Play Above $136 Support
On the 4-hour chart, Solana price has reclaimed ground above the $136 mark, where both the Parabolic SAR and Bollinger Band midline converge. The Parabolic SAR dots have flipped below the current candlesticks, suggesting a short-term bullish reversal is underway.

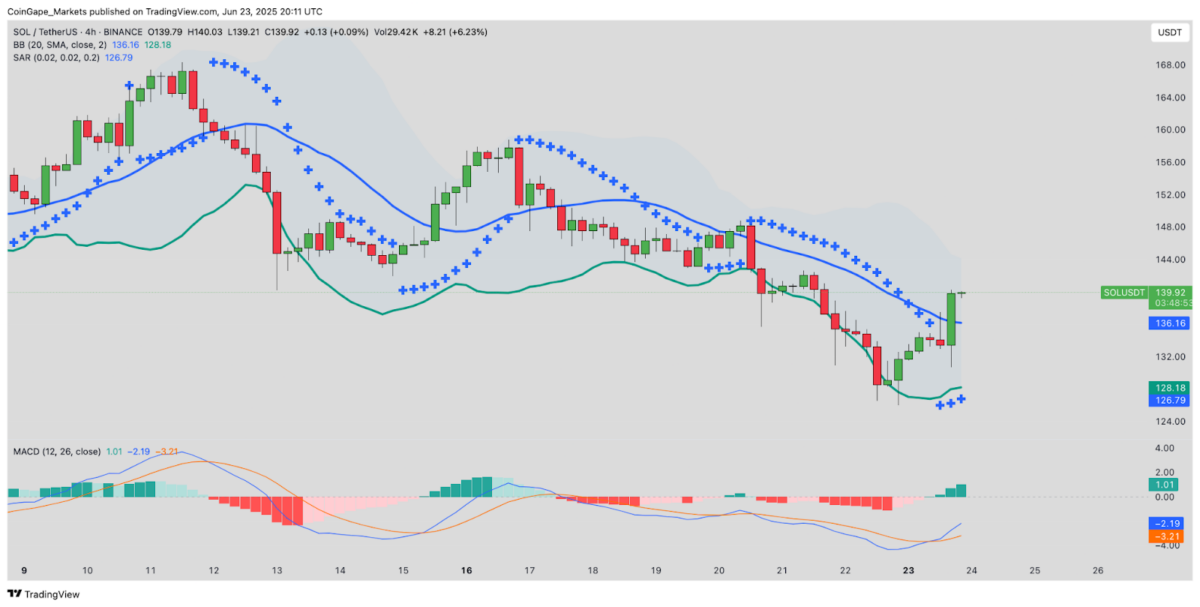
Solana price forecast | TradingView
Parabolic SAR is a technical indicator showing potential trend reversals through dots positioned above or below price candles, while Bollinger Bands consist of three lines – a middle moving average with upper and lower bands that expand and contract based on price volatility, helping identify overbought or oversold conditions when price touches the outer bands.
Additionally, MACD has flipped bullish, with the signal line beginning to converge upward, another indicator that short-term sentiment may be shifting. Should SOL maintain this momentum and close above the $140 psychological level, bulls may push towards the upper Bollinger Band at $147, with an extended target near $155 if macro sentiment aligns.
Conversely, failure to hold above $136 could see a retest of $130, which acted as a strong demand zone over the weekend.
Snorter Bot ($SNORT) Gains Momentum as Solana Memecoins Reheat
As Solana price finds footing, investor attention is shifting toward Solana-based memecoins with strong utility. One project gaining traction is Snorter Bot, a Telegram-native Solana intelligence tool powered by the $SNORT token.
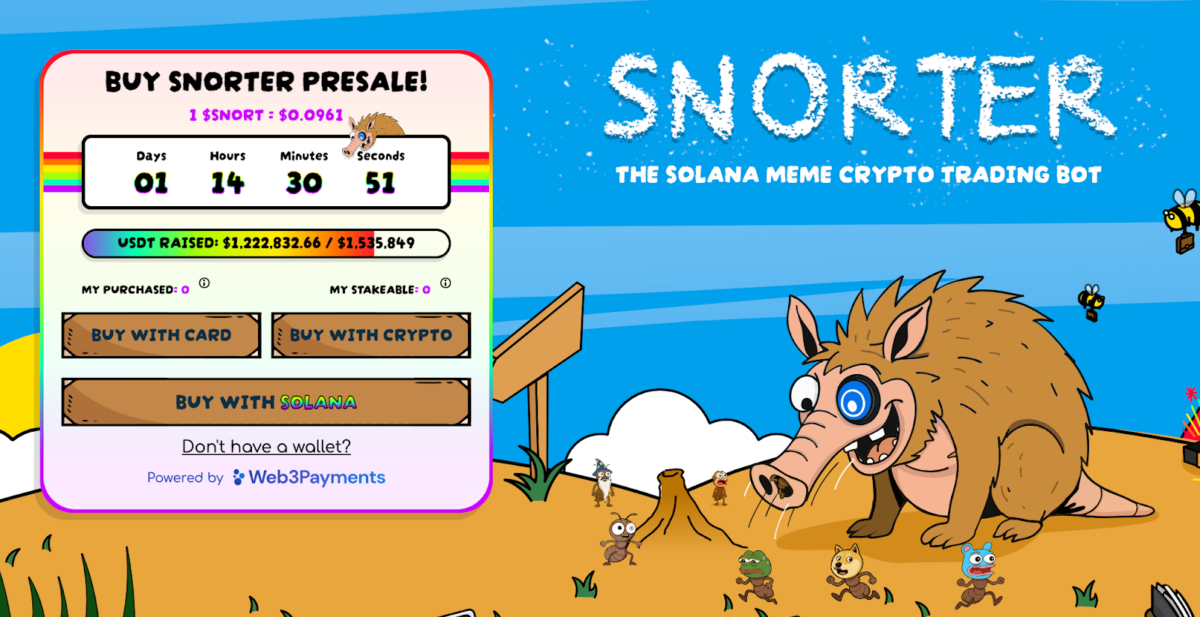

Snorter Bot scours the Solana memecoin markets to uncover trending tokens before they pump. It offers ultra-low fees, blazing transaction speeds, and protection against front-running and MEV risks, all running natively on Solana’s fast infrastructure.
With the meme coin cycle heating up again and SOL trading at attractive levels, Snorter Bot is positioning $SNORT as the next Solana breakout. Traders seeking alpha beyond the charts are increasingly turning to tools like Snorter Bot to stay ahead.
To join the $SNORT presale, visit the official Snorter Bot site or Telegram channel and connect your wallet.
next