Stellar Price Analysis: XLM/USD Trends of February 28–March 06, 2019

Updated on Apr 28, 2022 at 11:18 am UTC by · 2 min read

In case the bears increase its momentum the $0.07 demand level will be the target for Stellar price. Should the bears lose their pressure, the XLM price may range towards $0.09 – $0.12 price levels.

Key Highlights:

  • The bears may push the coin towards $0.07 price level;
  • the Stellar price may range towards $0.09 – $0.12 price level;
  • there is sideways movement in the XLM market.

XLM/USD Price Long-term Trend: Bearish

Supply levels: $0.09, $0.12, $0.14
Demand levels: $0.07, $0.06, $0.05XLM/USD is on the bearish trend on the long-term outlook. An attempt made by the Bulls to push the coin up to break the supply level of $0.09 was not successful last week. The combination of the barrier at the supply level and the dynamic resistance of 50-day EMA serve as strong opposition to the increase in the price of Stellar.

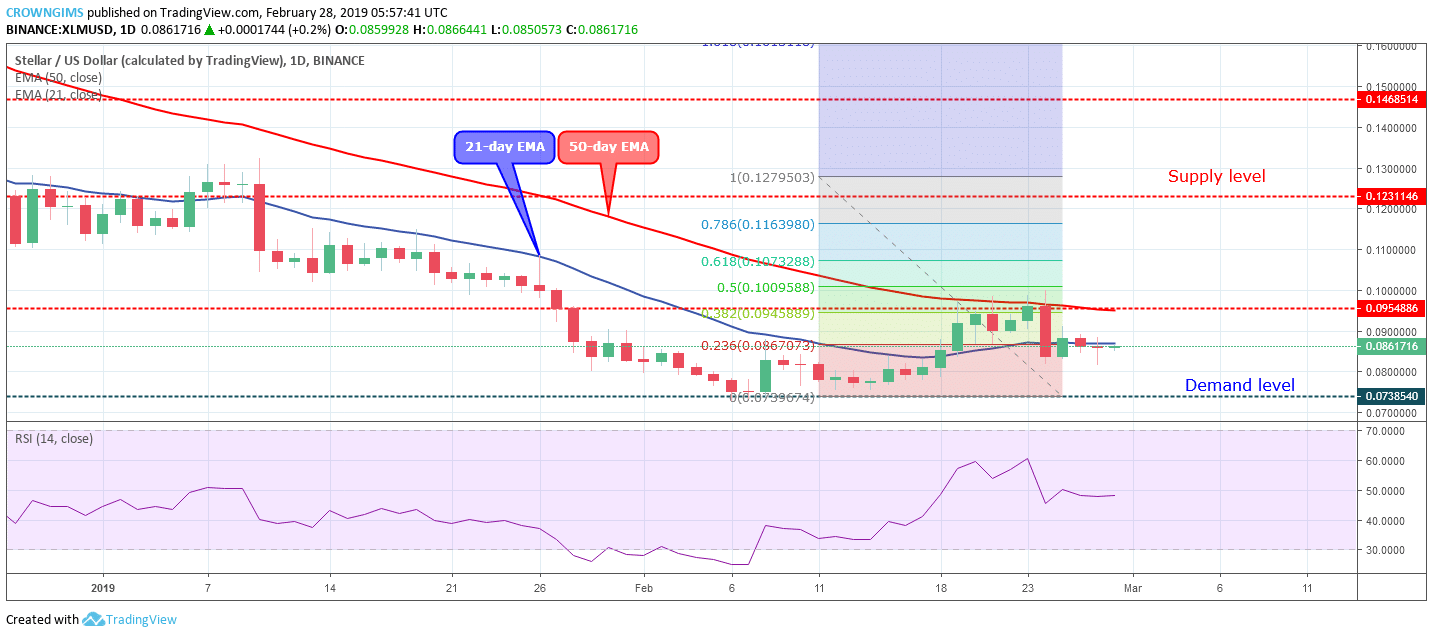
The push-up by the bulls now serves as a 50% Fibonacci retracement for the coin. The Bears pushed Stellar price down with the formation of the strong bearish engulfing candle at the $0.09 price level. There is a likelihood that the bearish trend will continue in the XLM market.

The XLM price is trending down towards the previous low. The coin is consolidating below the two EMAs but very close to the 21-day EMA and Relative Strength Index period 14 is at 50 levels horizontally placed and flat on the level indicates that consolidation is ongoing in the XLM market.

In case the bears increase its momentum the $0.07 demand level will be the target for Stellar price. Should the bears lose their pressure, the XLM price will range towards $0.09 – $0.12 price level.

XLM/USD Price Medium-term Trend: Bearish

XLM/USD turns bearish on the 4-Hour chart. The bullish momentum placed the XLM price above the supply level of $0.09 on February 24 after penetrated the level. Shortly after that the Doji star candle formed signaled the arrival of the bears with high momentum. Stellar price declined towards the low of $0.07 demand level by the massive strong bearish candle.

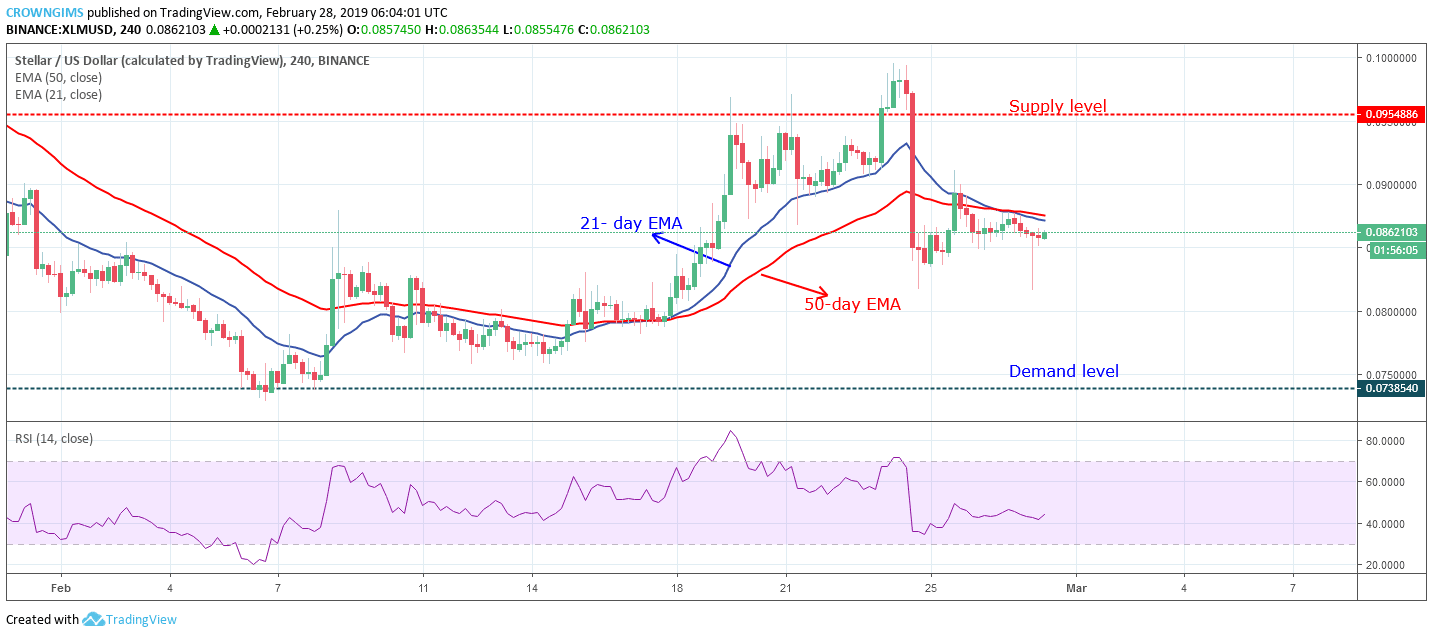
The XLM price is on the sideways movement below the 21-day EMA and 50-day EMA and the Relative Strength Index period 14 is at 40 levels making up and down movement which indicates that the sideways movement is ongoing and also serve as an indecision signal. Traders are advised to remain flat until clear direction.

Share:

Related Articles

Franklin Templeton Launches $380M Government Fund, Tokenizes It on Polygon, Stellar

By April 26th, 2024

Franklin Templeton maintains a leading position in the tokenized US Treasuries sector with its 32% market share.

Crypto Price Prediction: Game Changers, DTX, Cosmos (ATOM), and Stellar (XLM) Set To Shine

By April 5th, 2024

Cosmos, Stellar, and DTX are three likely options, and the latter’s innovative approach to traditional and digital currency trading intrigues investors. 

Web3 Infrastructure Platform Validation Cloud Raises $5.8M for Global Adoption

By February 27th, 2024

Validation Cloud is a leading figure in the domain of Web3 data streaming and infrastructure, providing seamless connections for organizations through its swift, scalable, and intelligent platform.

Exit mobile version