
The cryptocurrency made some faint bullish effort that was often followed by consolidation in the market and that led to the formation of “falling wedge” pattern; this may lead to increases in the rate.
Key Highlights:
- There is a consolidation pattern;
- we may expect the price to break out towards Northside, which may happen anytime;
- trader are advised to expect a clear signal to enter the market.
XLM/USD Long-term Trend: Bearish
Resistance levels: $0.24, $0.30, $0.36
Support levels: $0.19, $0.17, $0.15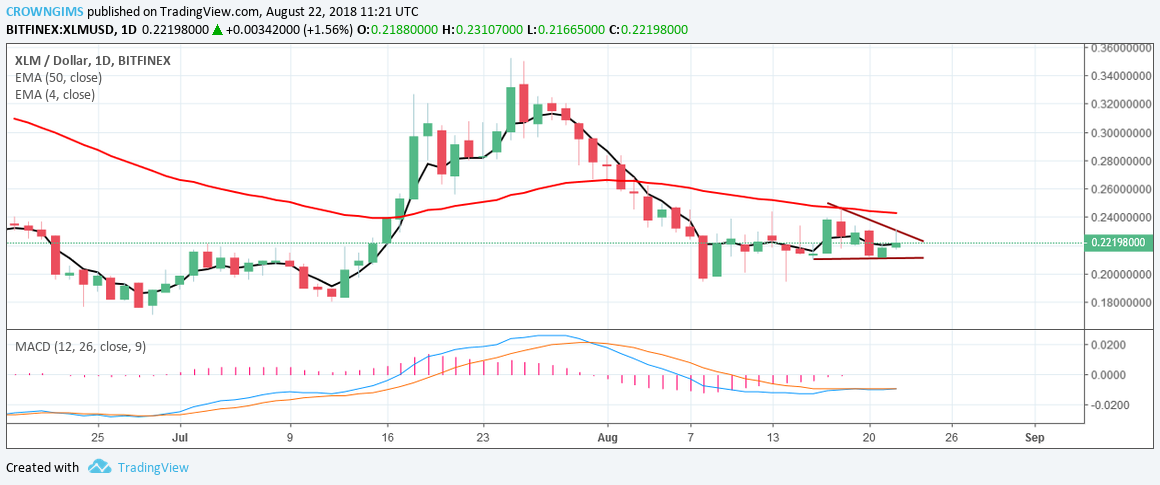

On the daily chart, MACD indicator is at the zero level with its signal lines twisted to each other, which indicates that the price is consolidating within a range. This does not rule out a possibility of a surge in price towards the resistance level at 0.24.
XLM/USD Price Medium-term Trend: Bearish
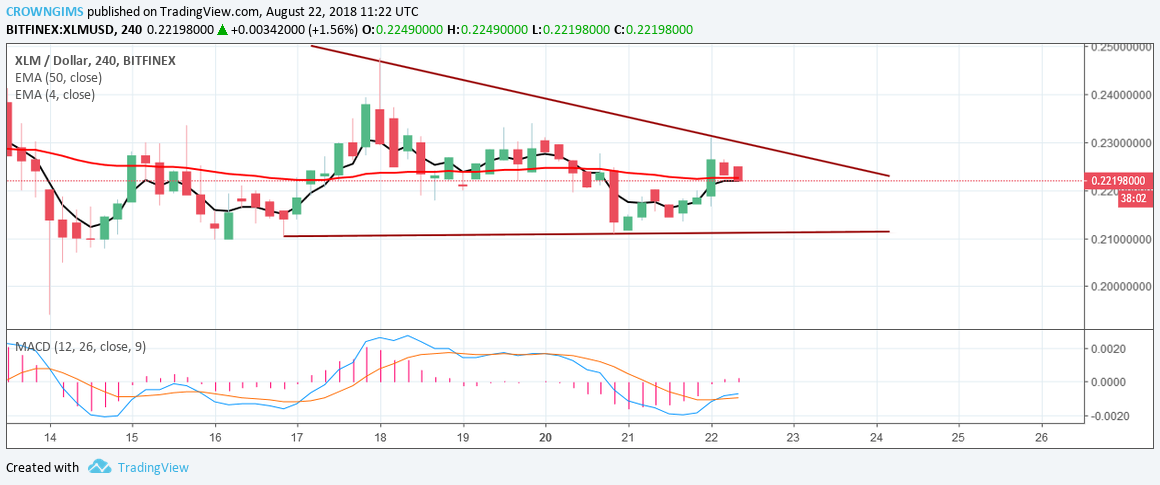
.There is a need for price to go above the resistance levels at $0.24 and $0.30 for a bullish bias to form. The support levels at 0.19 and 0.170 stand to be tested, and that may require a strong bearish effort. Traders are advised to expect a clear signal to enter the market.
next