
Should the price break and close above the supply level of $0.30, would interrupt the current bearish phase.
Key Highlights:
- Ranging within the channel continues;
- there is a possibility of an increase in price towards the Supply level at 0.24;
- traders should watch out for the breakout.
XLM/USD Long-term Trend: Bearish
Supply levels: $0.24, $0.30, $0.36
Demand levels: $0.19, $0.17, $0.15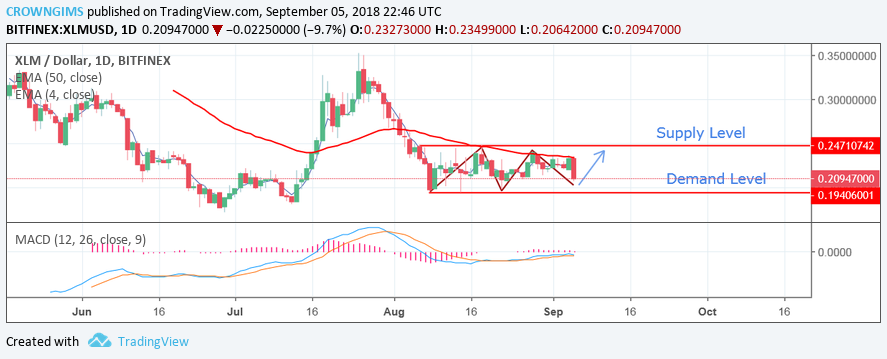

MACD indicator is at the zero level with its signal lines twisted to each other on the daily chart, which indicates that the consolidation of the price within a range may continue this week. This is a bear market, but that does not rule out a possibility of an increase in price towards the supply level at 0.24.
On the downside, a clear break and weekly close back below demand level of $0.19 would expose the price to the demand level of $0.17. Should the price break and close above the supply level of $0.30, would interrupt the current bearish phase. The price may break out from the channel that will lead to decreases in the rates.
XLM/USD Price Medium-term Trend: Bearish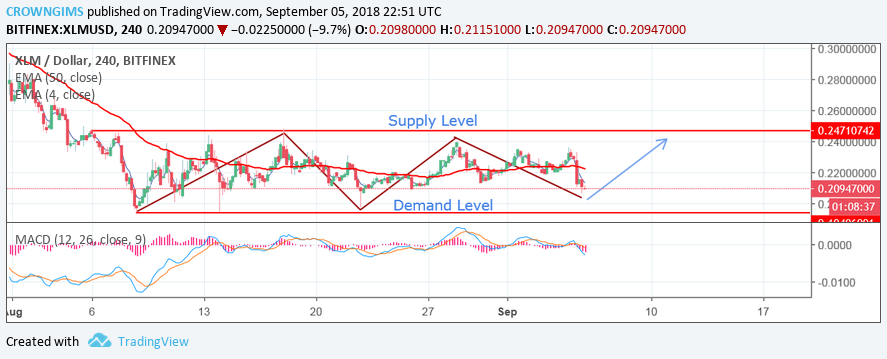
The Stellar continued ranging within the channel last week on the 4H chart. It bounced from the supply level of $0.24 and it was pushed to the demand level of $0.19, with the formation of the strong bearish candles on the medium term, which means that bears were in control. That does not mean that the price cannot move above the supply level of $0.24. As at present, the price is directed towards the south, the price will have to break the demand level of $0.19 for the continuation of a bearish movement and this will expose it to another demand level of $0.17. The 4-day EMA has crossed the 50-day EMA downside, the price is below 4-day EMA which indicates the possibility of further bearish movement. Traders should watch out for the breakout.
next