
MemeCore (M) and Virtuals Protocol (VIRTUAL) both turned bullish today, posting double-digit gains backed by rising volumes.
MemeCore (M) and Virtuals Protocol VIRTUAL $0.71 24h volatility: 0.8% Market cap: $464.78 M Vol. 24h: $64.52 M have both posted strong gains in the past 24 hours as the Fear and Greed Index remains neutral, suggesting uncertainty in the market.
MemeCore surged 17% while VIRTUAL climbed 10.41%, with trading volumes rising by 46.35% and 159.1% respectively.
Why Is MemeCore Rallying?
The rally in MemeCore comes after Gate.io confirmed that it will list M for spot trading on September 9, 2025.
Gate New Listing: $M @MemeCore_ORG
🔹 Trading Pair: $M / $USDT
🔹 Spot Trading Starts: 11:00 AM, September 9th (UTC)
Trade: https://t.co/NB5MK3Rv5a🔹 #MUSDT Perpetual Futures Listed
Trade: https://t.co/ny20Gl9kvJ pic.twitter.com/3SjweRdXFZ— Gate (@Gate) September 9, 2025
As the first Layer 1 blockchain dedicated to “Meme 2.0,” MemeCore is introducing what it calls the “viral economy,” a paradigm where meme coins evolve from speculative assets into cultural and economic forces.
Interestingly, alongside MemeCore, Gate.io also announced the listing of Linea (LINEA) with spot trading beginning on Wednesday.
MemeCore Price Analysis: What’s Next?
MemeCore has been consolidating its rally around the $2.05 mark after briefly touching the upper Bollinger Band near $2.10.
The Relative Strength Index (RSI) at 62.52 suggests that while momentum is strong, the token is not yet in extreme overbought territory, allowing room for further upside.

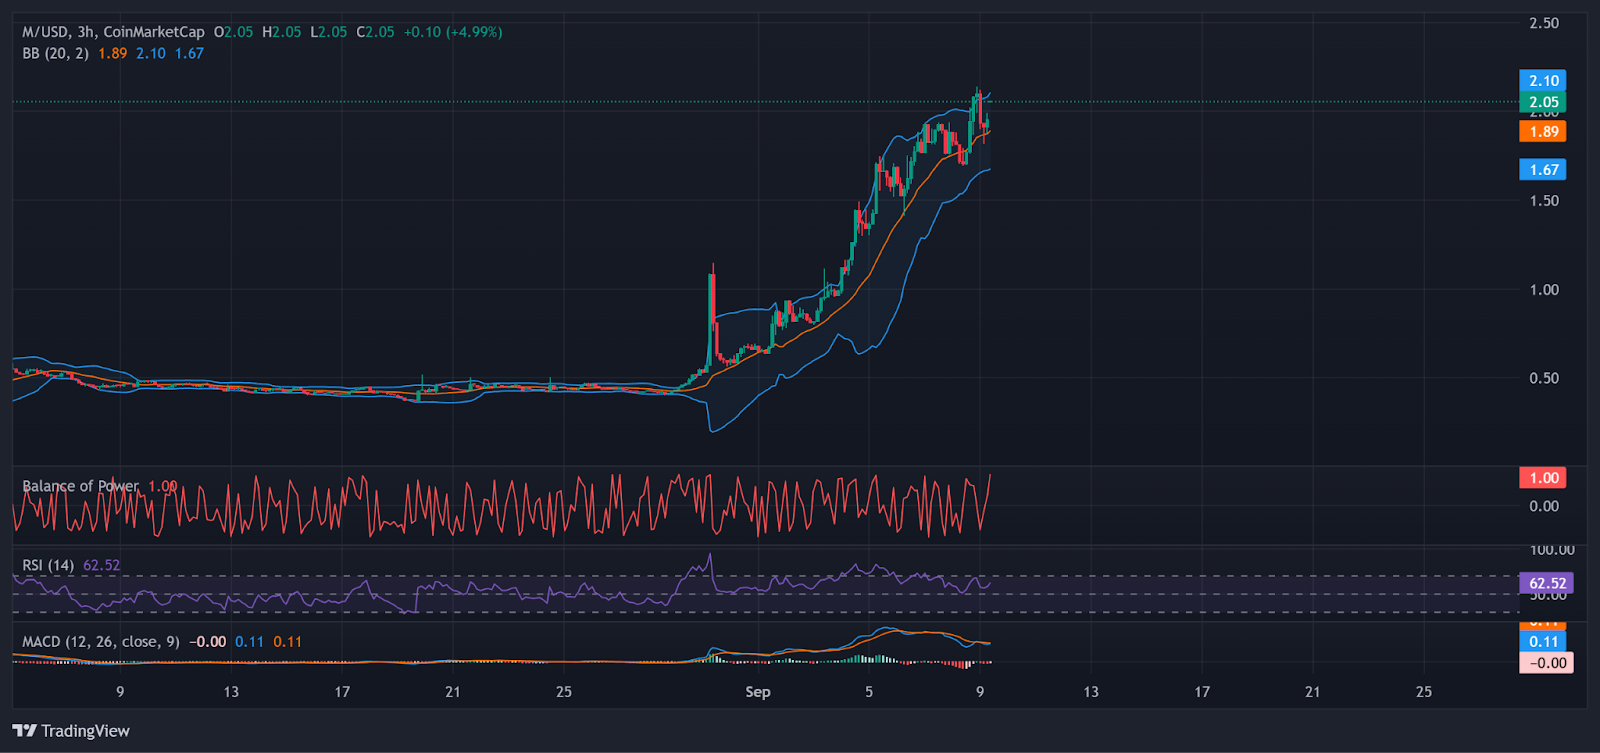
M price action with momentum indicators. | Source: TradingView
If M holds above $1.89 support, it could retest resistance near $2.10, with a breakout potentially opening the path toward $2.50.
Conversely, a breakdown below $1.89 could trigger a pullback toward $1.67.
Virtuals Protocol Website Is Back Online
Virtuals Protocol, meanwhile, turned bullish after reassuring its community about platform security.
Security Maintenance:
All Virtuals Protocol websites are undergoing temporary maintenance while we run a full security scan and upgrade protective measures.This is a proactive step to ensure the Virtuals ecosystem remains bulletproof safe, with system integrity and resilience… https://t.co/zYbJbqh71f
— Virtuals Protocol (@virtuals_io) September 8, 2025
The team carried out a proactive security scan and maintenance across its ecosystem following reports of compromised npm packages in a supply chain attack elsewhere in the industry.
After confirming zero vulnerabilities, Virtuals Protocol declared its systems safe and fully operational, boosting sentiment among holders and traders.
Security Maintenance Complete
All Virtuals Protocol websites are now back online. After completing a full security scan and upgrade cycle, we have confirmed that Virtuals Protocol carries zero risk or vulnerabilities related to the reported attack.
Our infrastructure remains… https://t.co/wIxmmen3c2
— Virtuals Protocol (@virtuals_io) September 9, 2025
VIRTUAL Price Analysis: Another Rally Brewing?
The 3-hour chart for VIRTUAL shows a breakout from a descending channel on the 3-hour time frame, with the price pushing above the upper trendline.
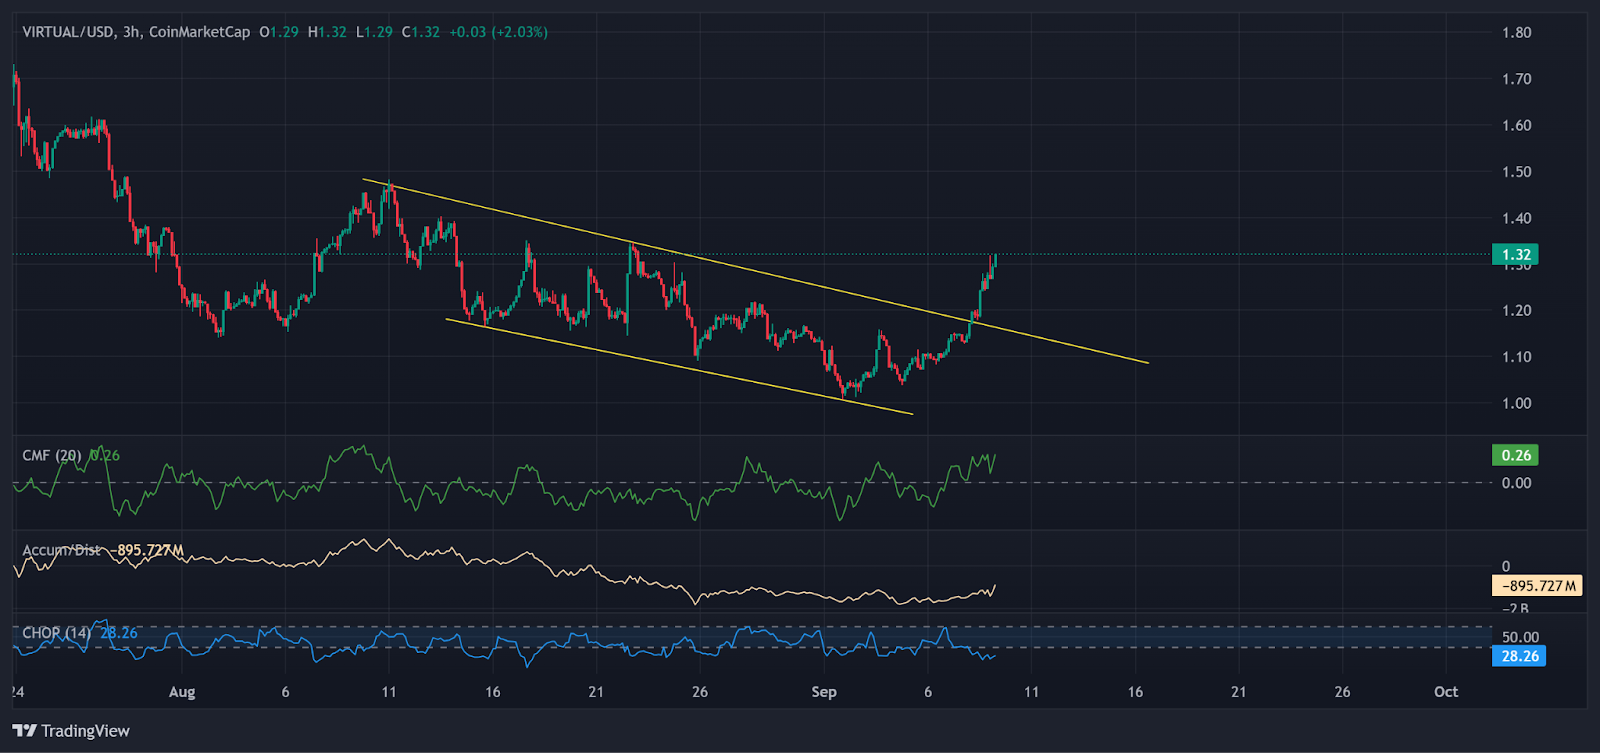
VIRTUAL price breaking out of descending triangle. | Source: TradingView
The Chaikin Money Flow (CMF) indicator is currently at 0.26, indicating a positive money flow and suggesting that buying pressure may be building.
Despite this, the Accumulation/Distribution indicator shows a negative value of -895.727M, which shows a history of selling pressure.
The Choppiness Index, at 28.26, points to a relatively low level of market choppiness, hinting that a clearer trend may be forming, making VIRTUAL as potentially the cheapest crypto to explode this year.
next