
Worldcoin (WLD) slumps nearly 8% amid mounting bearish pressure, but whale accumulation hints at a possible reversal soon.
Worldcoin WLD $0.32 24h volatility: 4.5% Market cap: $999.77 M Vol. 24h: $130.41 M tumbled nearly 8% in the past 24 hours, dropping to around $0.9344 at the time of writing. The market capitalization has plummeted by $120 million over the same period, now sitting at around $1.52 billion.
While retail traders appeared worried by this downturn, blockchain data indicates that whales are quietly accumulating. According to LookonChain, two newly created wallets withdrew a combined 18.2 million WLD worth around $17.17 million from Binance.
2 newly created wallets withdrew 18.2M $WLD($17.17M) from #Binance ~30 minutes ago.https://t.co/9IYzWrBiXnhttps://t.co/iVrvRrseoq pic.twitter.com/XeN1OK6D6Q
— Lookonchain (@lookonchain) June 17, 2025
The large-scale withdrawal reduces exchange liquidity, often leading to heightened price swings or preparation for OTC (over-the-counter) deals. Analysts suggest that this could mark the early signs of a bottom forming.
In the short term, WLD remains under bearish pressure. The token has shed nearly 18% over the past month, wiping out roughly $900 million in market capitalization since May 22. Technical analyst AltCryptoTalk noted that WLD broke below a rising wedge pattern on the daily chart last week.
The real human network.🧍♂️#WLD turned bearish after breaking below the rising blue wedge.
As it approaches the lower bound of the range at $0.50 once again, we’ll be looking for new long opportunities!
In that case, we would expect a bullish continuation… pic.twitter.com/zQ8xmsVneT
— AltCryptoTalk (@AltCryptoTalk) June 16, 2025
The analyst believes that the price could retest the horizontal support level at $0.50. Should this level hold, traders may look to re-enter with targets near $1.50.
However, zooming out to the longer-term picture, WLD appears to have broken out of a multi-month falling wedge pattern in April. This hints at a potential macro rally if supported by volume and momentum.
🚨 $WLD looks ready to explode
Indicators flashing bullish:
✅ RSI momentum picking up
✅ Major falling wedge breakout
✅ Long-term structure looks primed
People still sleeping on @worldcoin while it’s building real-world utility.
📈 Buy before it runs.
Let $WLD cook good steak🔥 pic.twitter.com/nR1nn6zYHk— Keven Montgomery (@Montagomer) June 16, 2025
WLD Price Outlook
On the daily WLD price chart, the RSI is currently signaling oversold conditions. A further dip would suggest stronger bearish momentum, but the current level may entice buyers to enter.

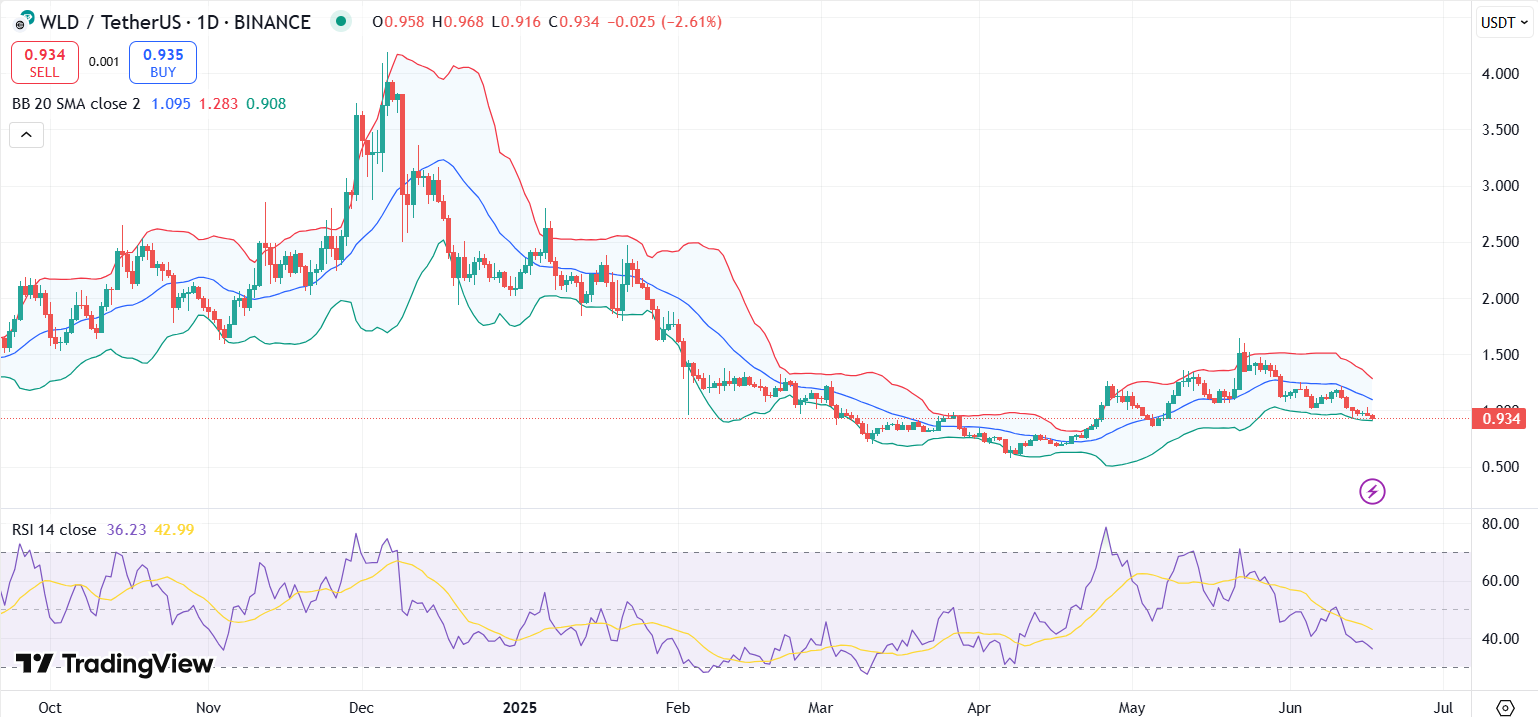
WLD price chart with RSI and Bollinger Bands | Source: TradingView
Bollinger Bands are beginning to shrink, suggesting declining volatility. Moreover, the price has broken below the lower band. A close above the $1.10 resistance level could lead to bullish continuation.

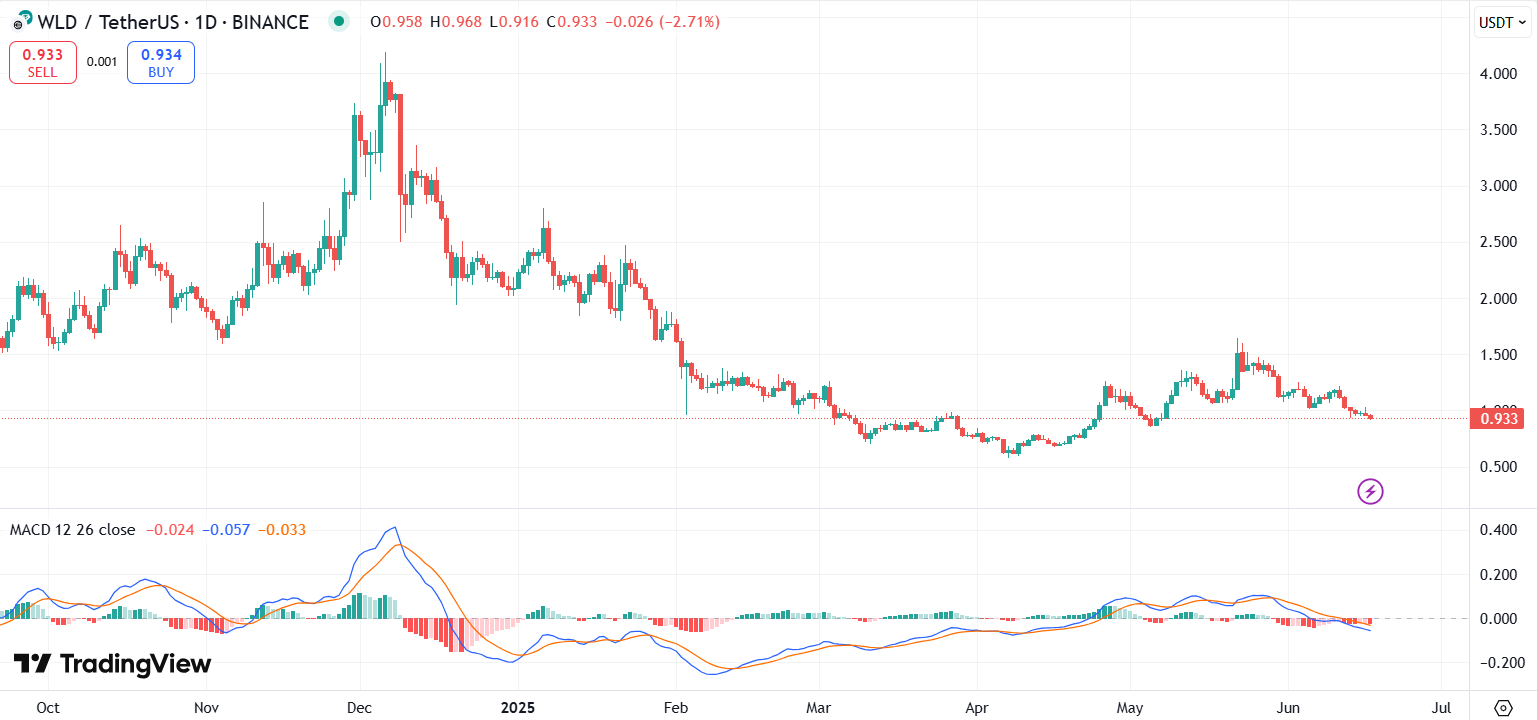
WLD price chart with MACD | Source: TradingView
Meanwhile, the MACD shows a bearish crossover with the MACD line crossing below the signal line. Both lines are below the zero level, reinforcing downward pressure. Traders could see strong support around $0.90 and $0.50.
next