
Bitcoin faces selling pressure as Riot Platforms offloads $38.8 million in BTC and a sell signal flashes on the charts.
Bitcoin miner Riot Platforms offloaded $38.8 million worth of BTC BTC $64 468 24h volatility: 0.2% Market cap: $1.29 T Vol. 24h: $16.14 B in April, joining a growing number of miners liquidating holdings. While the firm’s deployed hash rate held steady, its Bitcoin production declined by 13% from March.
This highlights how block reward cuts from the April 2024 halving are affecting miners’ operational efficiency. The sell-off comes as the broader mining landscape is under pressure.
Notably, April 7 witnessed the third-largest miner selloff of 2025, with 15,000 BTC sent to exchanges in a single day, per CryptoQuant.
Meanwhile, analyst Ali Martinez recently flagged a sell signal for Bitcoin on the 3-day chart, further fueling caution in the market.
#Bitcoin $BTC flashes a sell signal! pic.twitter.com/97hj7iObdQ
— Ali (@ali_charts) May 4, 2025
The Coinbase Premium Gap confirms the selling pressure, turning negative once again, currently at -5.07. This suggests US investors are increasingly selling BTC on Coinbase, dragging the price lower compared to other global platforms.

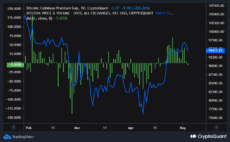
Coinbase premium gap | Source: CryptoQuant
If the Coinbase Premium remains in negative territory, short-term downside risk could escalate, especially amid growing miner outflows.
BTC Price Outlook
At the time of writing, Bitcoin is consolidating around $94,400 after a brief rally to $97,600 last week. On the daily BTC price chart, the RSI stands at 60, suggesting the largest cryptocurrency remains in bullish territory but is losing momentum.
A further drop in RSI could shift the sentiment to bearish. Immediate support lies near, while. A decisive break below $92,000 support could send BTC further downwards in the short-term.

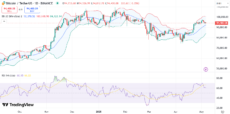
BTC price chart with Bollinger bands and RSI | Source: TradingView
Bollinger Bands are tightening slightly after a recent expansion, with the price approaching the upper band. The cryptocurrency could face resistance around $96,800 and traders could see a pullback toward the middle band (20-day SMA) near $92,370.

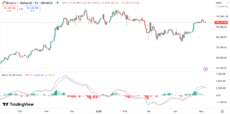
BTC price chart with MACD | Source: TradingView
Meanwhile, the MACD histogram is beginning to fade, with a possible bearish crossover in the near term.
next