
Bitcoin plunged to $108K in a sharp correction even as ETFs broke their six-day outflow streak with $219M in inflows.
Bitcoin BTC $68 430 24h volatility: 5.4% Market cap: $1.37 T Vol. 24h: $52.41 B shocked markets with a sudden crash to $108,000, unable to break above $113,000. The decline comes as spot Bitcoin ETFs ended their longest-ever outflow streak, adding a surprising twist to BTC price action.
On August 25, Ethereum spot ETFs recorded $444 million in total net inflows, marking three consecutive days of inflows. Bitcoin spot ETFs saw $219 million in total net inflows, with none of the twelve ETFs reporting outflows.
https://t.co/Tvs2oCSxTg— Wu Blockchain (@WuBlockchain) August 26, 2025
ETF Outflows End with $219M Inflows
On Monday, market intelligence firm Santiment reported that Bitcoin ETFs were facing their longest outflow streak in months, six consecutive market days, a pattern not seen since tariff fears peaked in April.
According to Santiment, this wave of withdrawals may have been retail-driven rather than purely institutional, with smaller traders reacting emotionally to fears of a market top.
📉 Bitcoin ETF's are on their longest outflow streak (6 market days) since the tariff fears peaked back in early April. Increasingly, there are cases to be made that these inflows & outflows are retail-driven, and not just institutional-driven like they were early on.
😱 Large… pic.twitter.com/bM6t19gfgM
— Santiment (@santimentfeed) August 26, 2025
But on Aug. 26, sentiment appeared to shift. SoSoValue data confirmed that Bitcoin ETFs collectively saw $219 million in inflows, with none of the twelve funds reporting outflows.
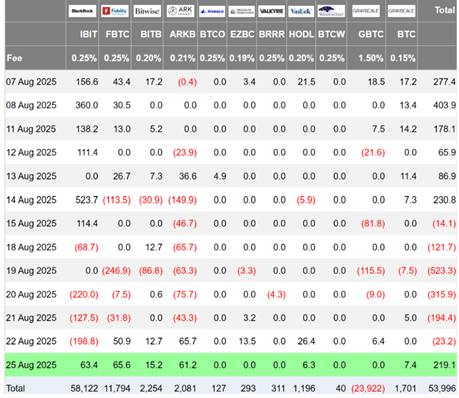

US spot BTC ETFs’ performance for August | Source: Farside
Fidelity’s FBTC led with $65 million in inflows, while BlackRock’s IBIT attracted $63.38 million. The rebound suggests institutions and retail traders alike may be positioning for a recovery amid the BTC crash.
Derivatives Market: Excessive Optimism Raises Liquidation Risk
According to CryptoQuant, Binance funding rates in August 2025 highlighted a concerning divergence between derivatives sentiment and actual price action.
Despite Bitcoin’s decline, funding rates stayed consistently positive (0.005–0.008), indicating that traders kept piling into leveraged long positions.
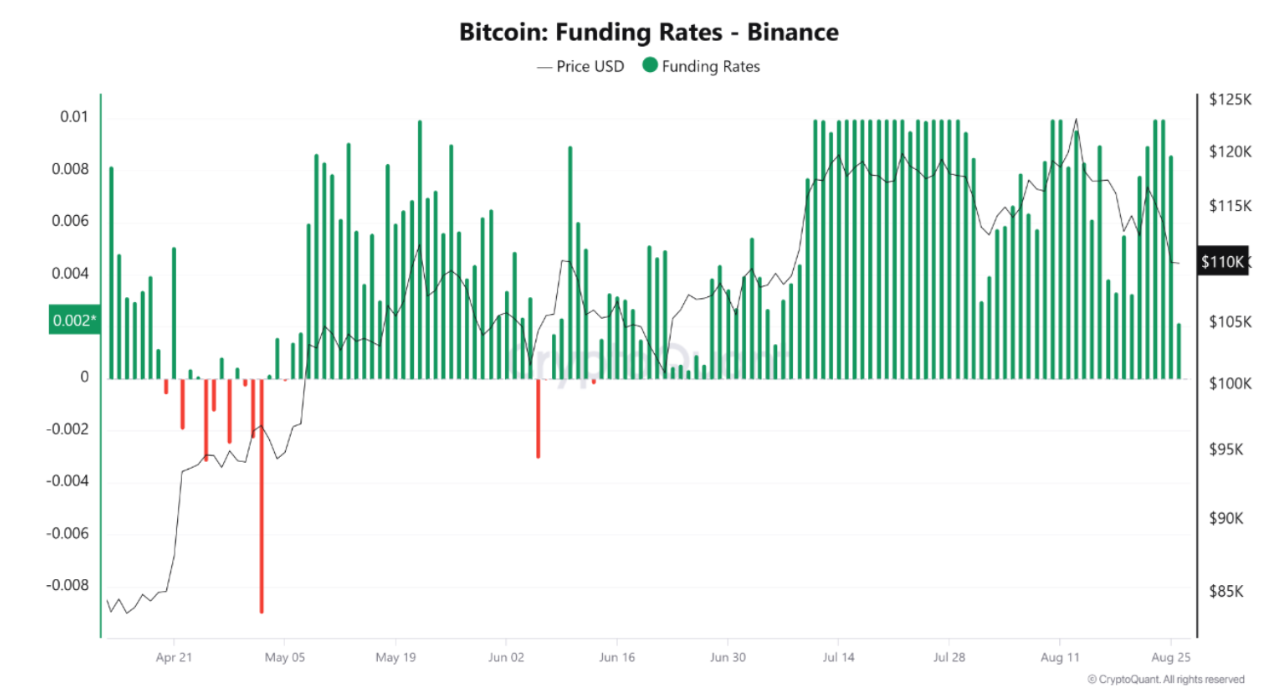

Bitcoin funding rates on Binance | Source: CryptoQuant
It’s clear that the traders are betting on a rebound, viewing the drop as temporary. This keeps long positions open despite mounting losses.
However, if Bitcoin continues to fall, these leveraged longs could trigger cascading liquidations, a long squeeze that accelerates the sell-off.
Bitcoin Price Analysis: Key Levels to Watch
The daily chart shows Bitcoin breaking down from an ascending triangle, confirming bearish pressure. Current price action around $109,800 has dropped below short-term support, raising risks of deeper corrections.
The immediate support is at $108,000, with $105,000 and $100,000 as key demand zones. On the other hand, $117,800 (Fib 0.236) and $121,300 (Fib 0.382) need to be reclaimed for a bullish reversal.
A successful breakout could reopen paths to $131,000 and ultimately $151,000 (Fib 1.618).
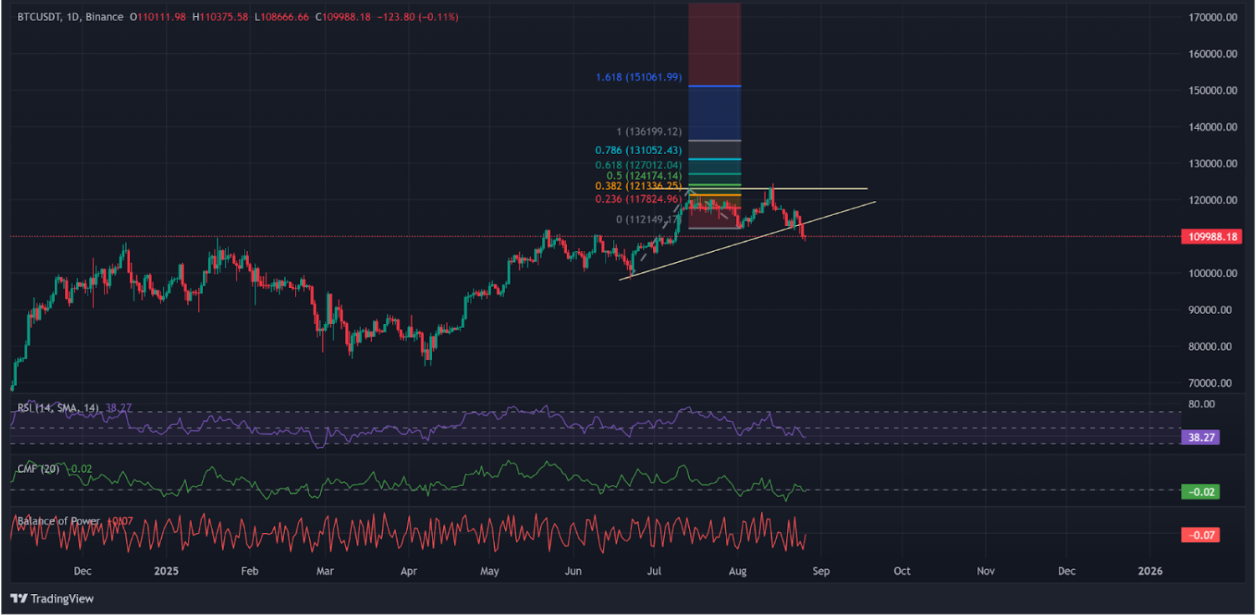

Bitcoin daily chart with Fib levels and momentum indicators | Source: TradingView
Momentum indicators support the bears with the RSI (38.2) showing weakening strength, while Chaikin Money Flow (-0.02) suggests capital outflows. The Balance of Power (-0.07) also confirms that sellers currently dominate the market.
If Bitcoin fails to hold $108K, the path toward $100K becomes increasingly likely. Meanwhile, reclaiming $117K and $121K could stabilize momentum and set the stage for another push toward new ATHs. As a result, some traders view BTC as one of the best crypto to buy.
next