
Radical fundamental force may be required to break up the strong resistance level of $8,233. The resistance level may be broken up should the Bulls push up Bitcoin price and touch the level of $8,233 fourth time.
Key Highlights:
- Bitcoin price is consolidating at $7,812 level;
- strong bullish momentum is required to break up the $8,233 level;
- the Bears may break down the $7,812 level.
BTC/USD Medium-term Trend: Ranging
Resistance levels: $8,233, $8,678, $9,265
Support levels: $7,812 $7,440, $6,869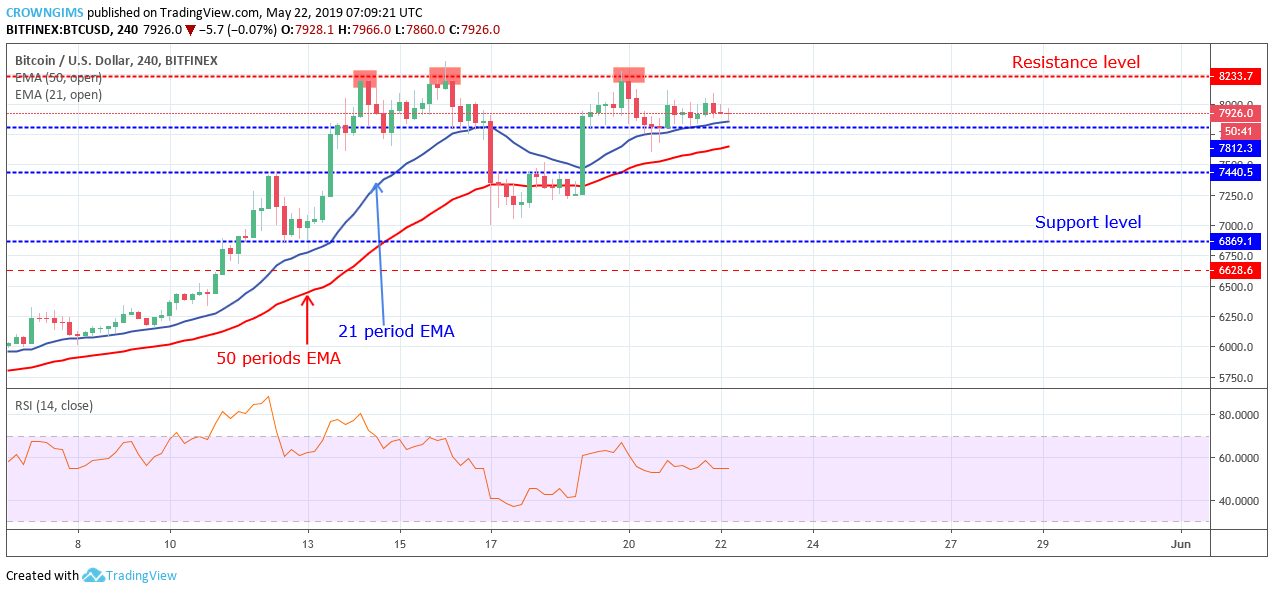

Radical fundamental force may be required to break up the strong resistance level of $8,233. The resistance level may be broken up should the Bulls push up Bitcoin price and touch the level of $8,233 fourth time.
In case the Bulls have no momentum to drive the coin and the demand level of $7,812 does not hold, bearish pressure may expose the $7,440 level. However, the Relative Strength index period 14 is flat horizontally at the level above 50; this confirms the ongoing consolidation movement in the BTC market.
BTC/USD Short-term Trend: Ranging
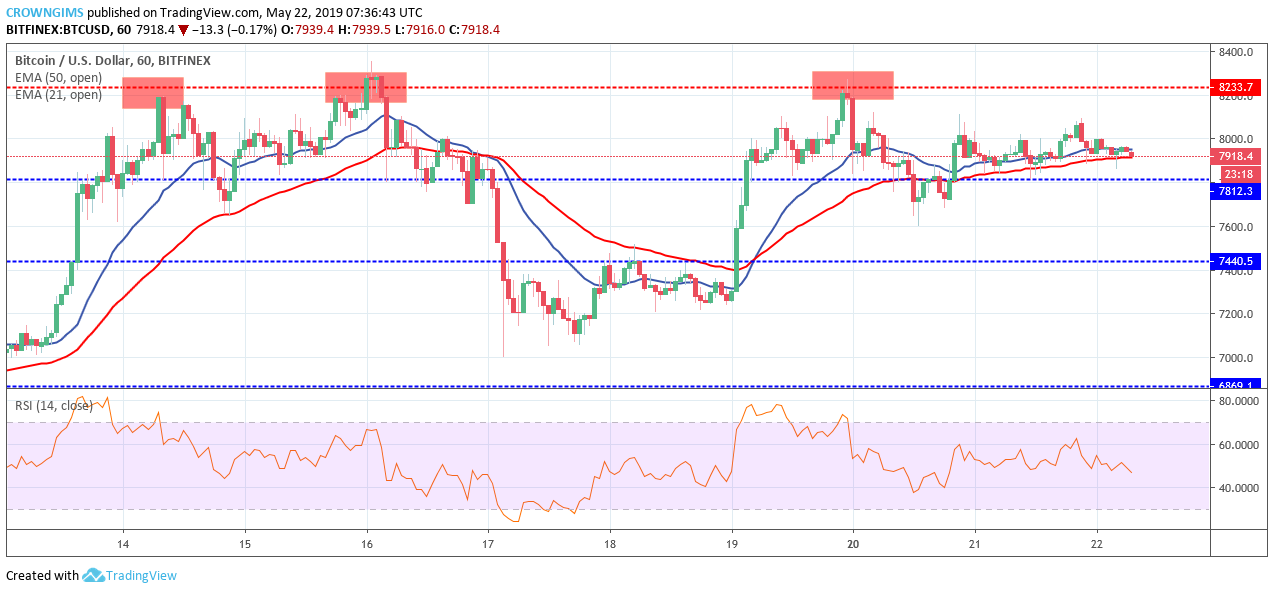
Nevertheless, the Relative Strength Index period 14 is at 50 levels with the signal line bending to the south which indicates a sell signal.
next