
Because of confluence at $68 price level, only the strong bullish momentum can break up the resistance level of $68 and expose the $85 price level, otherwise, Bitcoin SV may breakdown the $54 support level and $41 become the next low.
Key Highlights:
- The bears were in control of the Bitcoin SV market;
- sideways movement confirmed in the Bitcoin SV market;
- the downtrend may continue in case the bears increase their pressure.
BSV/USD Price Long-term Trend: Ranging
Resistance levels: $68, $85, $100
Support levels: $54, $41, $30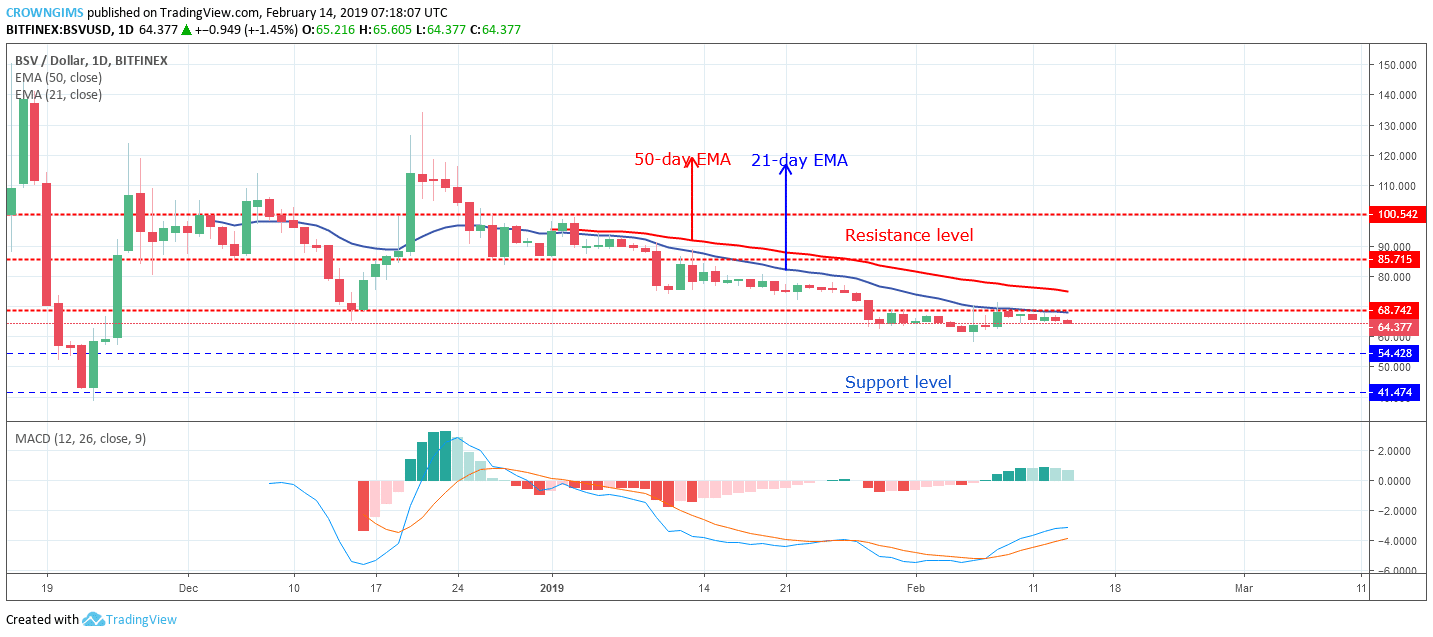

The 50-day EMA remains above the 21-day EMA and the Bitcoin SV ranging below the two EMAs. The Moving Average Convergence Divergence (MACD) with its histogram above the zero levels and the signal lines below zero level horizontally placed indicate that consolidation is ongoing in the Bitcoin SV market.
Because of confluence at $68 price level, only the strong bullish momentum can break up the resistance level of $68 and expose the $85 price level, otherwise, the coin may continue its downtrend by breakdown the $54 support level and $41 become the next low.
BSV/USD Price Medium-term Trend: Ranging
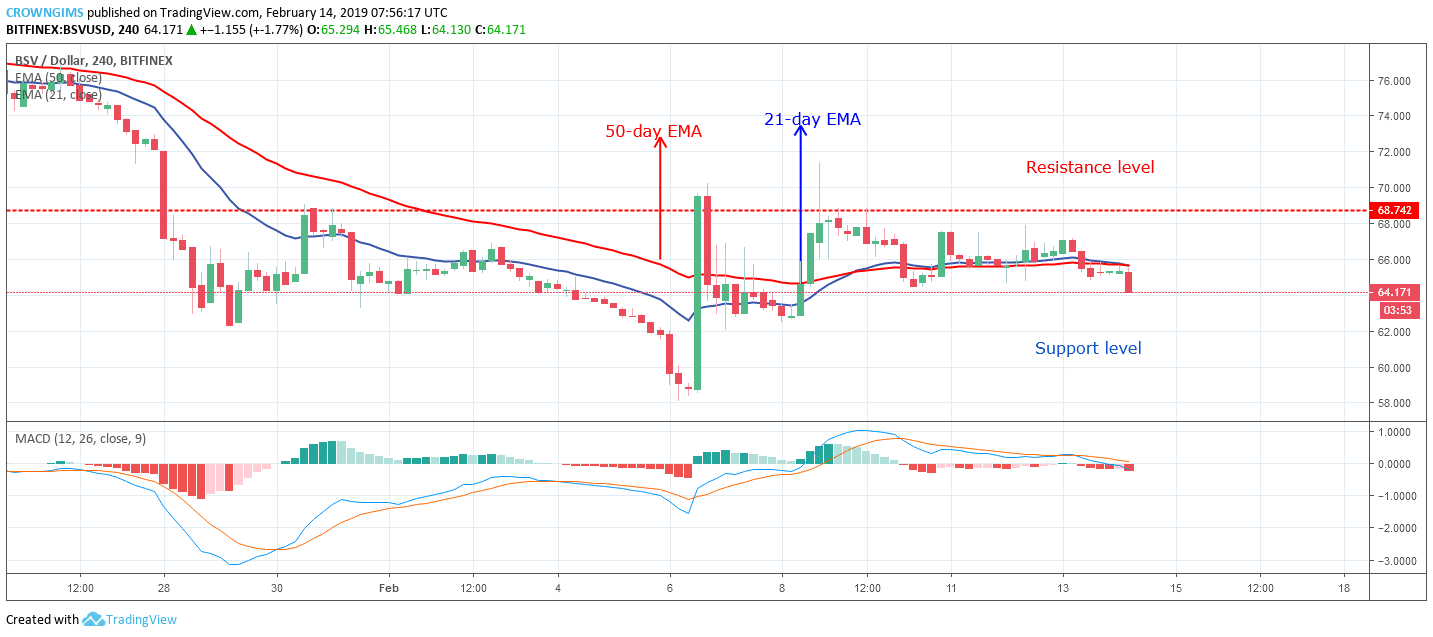
Bitcoin SV/USD is also ranging on the medium-term outlook. The sideways movement started on February 6 when the bearish momentum rejected the further increase in the price of Bitcoin SV. The bears and the bull’s momentum were within the range of $68 resistance level and $54 support level.
The two EMAs were interlocked to each other which indicate that the coin is consolidating and also the BItcoin SV is trading on the 21-day EMA and 50-day EMA. The MACD period 12 with its histogram is flat to the zero levels together with its signal lines indicates further consolidation in the Bitcoin SV market which may not be for a long period of time.
next