
Dmitriy Gurkovskiy, a senior analyst at foreign exchange broker RoboForex, provides his vision of the possible tendencies in price changes for Bitcoin as well as for other major cryptos.
Bitcoin added 2% and was trading close to $9,400. Today, the asset is correcting. At the moment, any somewhat significant impulse is perceived as the start of another mid-term wave. However, this time these expectations may be justified. The Bitcoin dynamics exceeded that of the stock market and trading volumes increased by more than 30%. Altcoins followed Bitcoin. The fear and greed index improved by 6 points and rose up to 50 points. All these factors taken together reflect the correlation between Bitcoin and conventional financial markets. Mostly this is due to the weakening of the USD on the currency market but such a correlation makes it easier to understand and predict the behavior of cryptocurrencies.
Bitcoin
As we can see in the H4 chart, after breaking the resistance level, Bitcoin is trying to test the level from above. It should also be noted that before breaking the line, the asset was forming the rising channel and “lifting” the lows. In the short-term, BTC/USD may grow towards the local resistance line at $9,670. A signal in favor of this idea is the “Golden Cross” and the following rising movement of the MACD lines. However, before forming another impulse, the instrument may correct down to $9,225. The key resistance is still at $10,000.
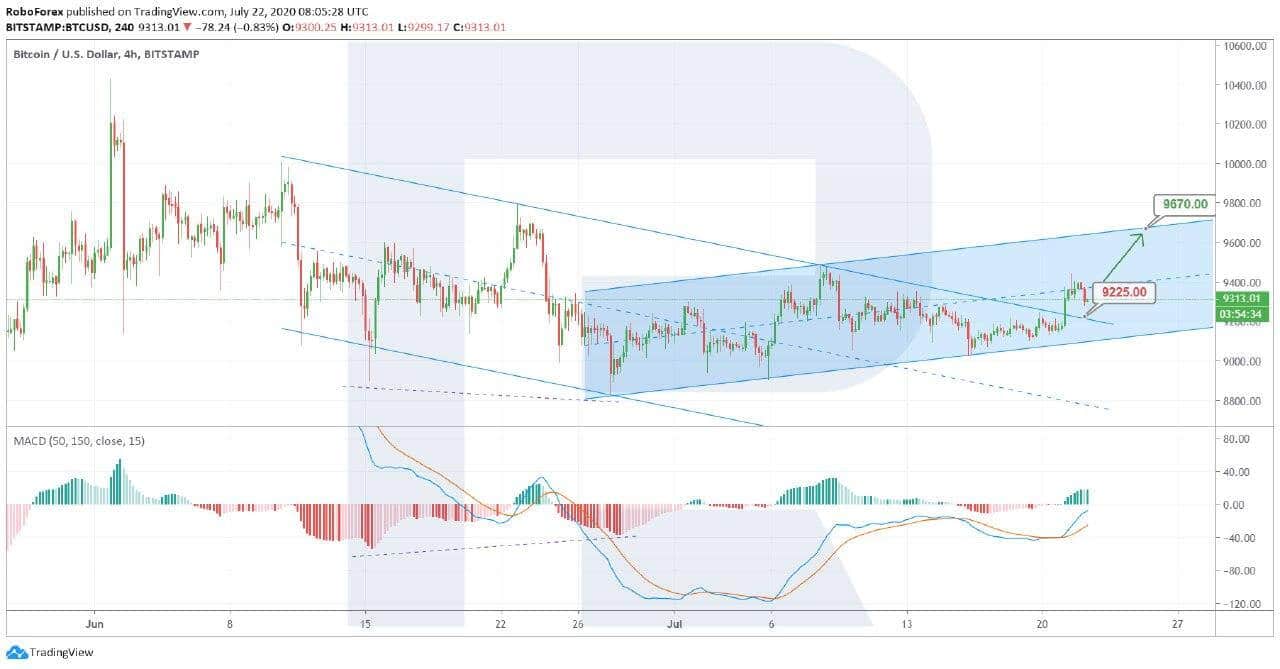
Photo: RoboForex / TradingView
The H1 chart shows a more detailed structure of the current pullback. While moving in the “overbought area”, Stochastic Oscillator is preparing the “Black Cross” to confirm a short-term correction. The downside correctional targets may be at $9,195 and $9,112.90. After finishing the correction, the market may start a new growth towards the high and $9,455.
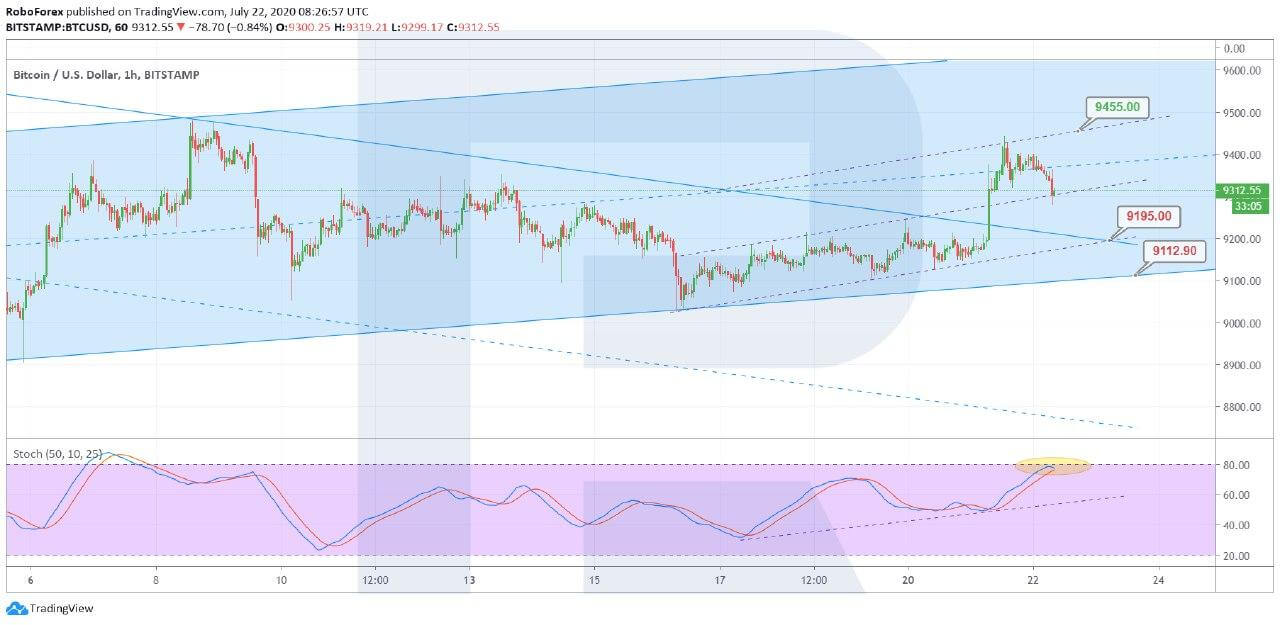
Photo: RoboForex / TradingView
Ethereum
In the H4 chart, after several descending waves and the convergence on MACD, ETH/USD is slowly but steadily forming a stable rising channel. After testing the support line and rebounding from it, the asset is moving towards the previous fractal high and the long-term high at $253.69. The “Golden Cross” on MACD and the movement above 0 indicate further growth. There is a high probability that the instrument may break the high, reach the resistance level at $261.57, and then start a new pullback. At the moment, after reaching the middle of the channel, the asset is correcting. The key correctional target is the support level and $234.45.
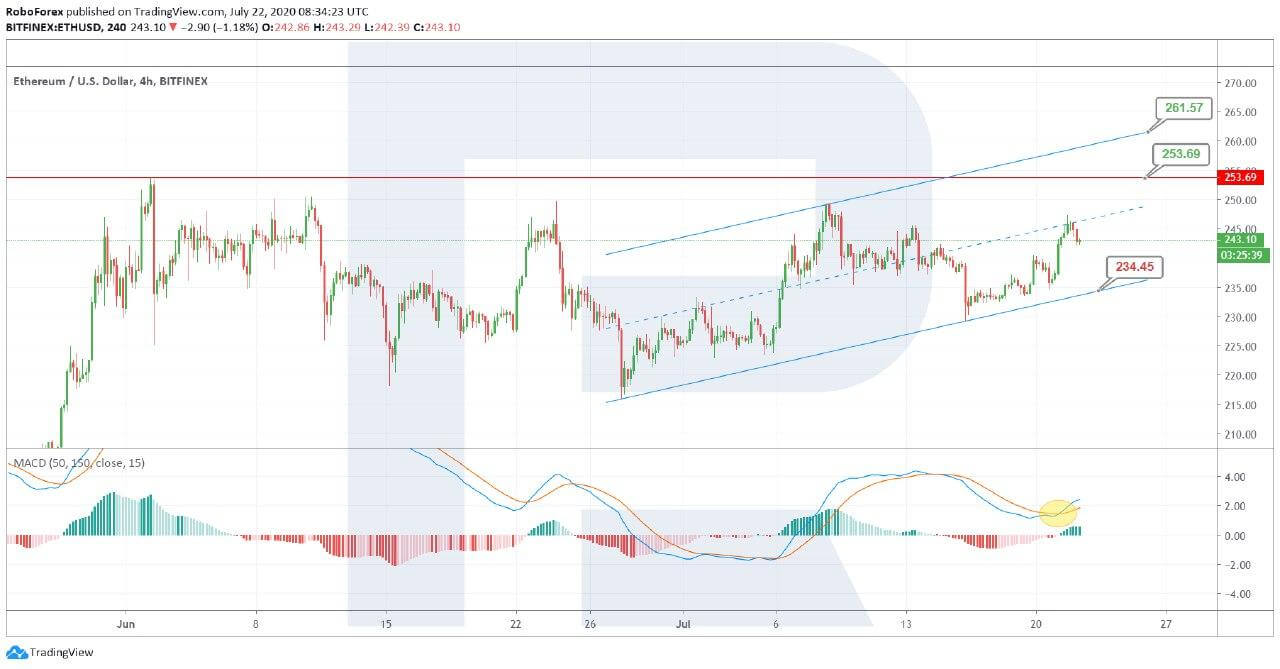
Photo: RoboForex / TradingView
As we can see in the H1 chart, the previous impulse has broken the rising channel’s upside border, thus indicating an increasing pressure from bulls. Stochastic Oscillator’s entering the “overbought area” along with a pullback to test the broken line may indicate that the mid-term ascending wave reached stability. However, one shouldn’t exclude a possibility that Ethereum may correct towards $237. After the pullback, the next rising impulse may test the high at $253.69.
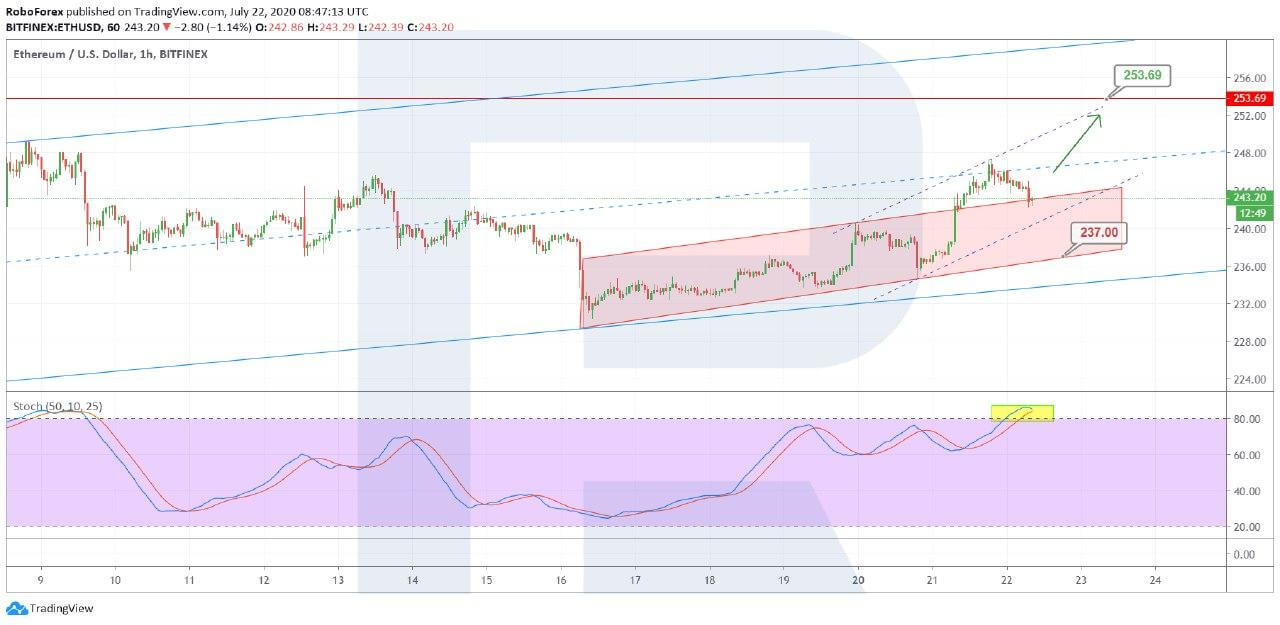
Photo: RoboForex / TradingView
Litecoin
As we can see in the H4 chart, Litecoin is moving within a long-term consolidation range. At the same time, one should note that after testing and rebounding from the downside border of the long-term channel, the asset broke the resistance line of the previous descending channel, and right now is forming a wide ascending channel. In this new ascending channel, the price tested its downside border and rebounded from it, while the “Golden Cross” on MACD may indicate a further growth towards the key target – the long-term resistance line at $47.90. The current support is at $41.70.
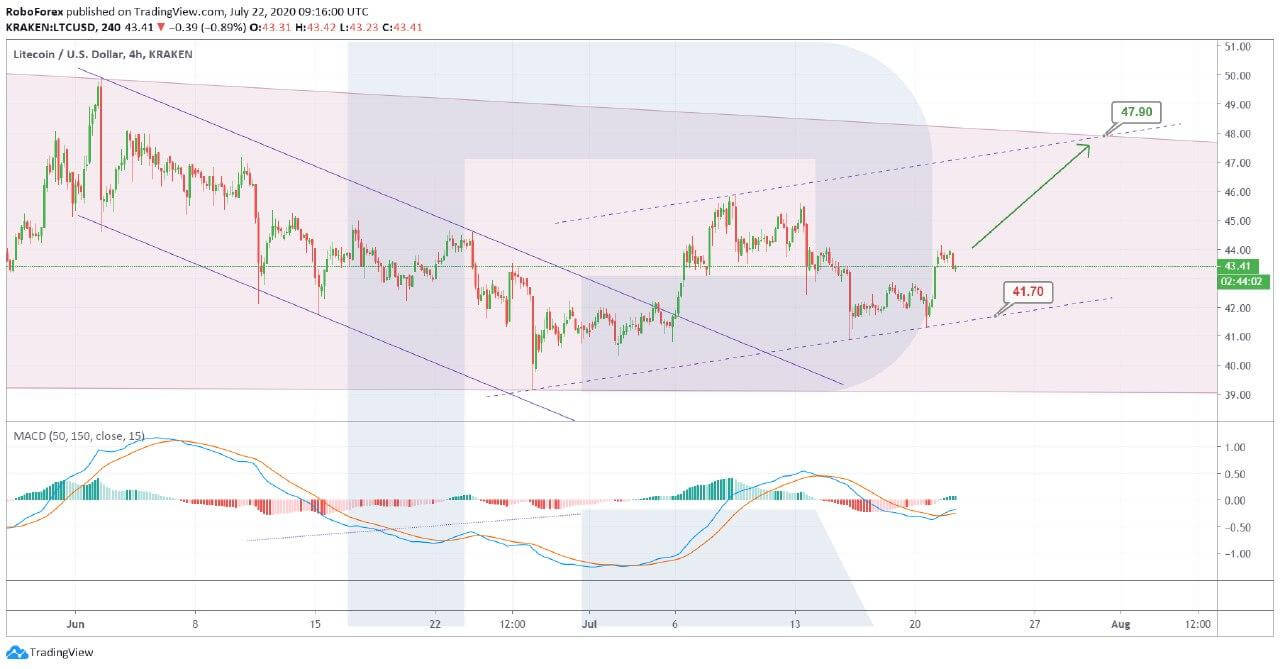
Photo: RoboForex / TradingView
In the H1 chart, LTC/USD is correcting after completing the rising impulse; right now, it is returning to the middle of the ascending channel. However, the “Black Cross” on Stochastic Oscillator may indicate a correctional decline not only towards the local support level at $43.00 but also the key one at $41.70. After finishing the pullback, the price may start another rising impulse, which may face resistance at $45.00 and form a short-term consolidation range there.
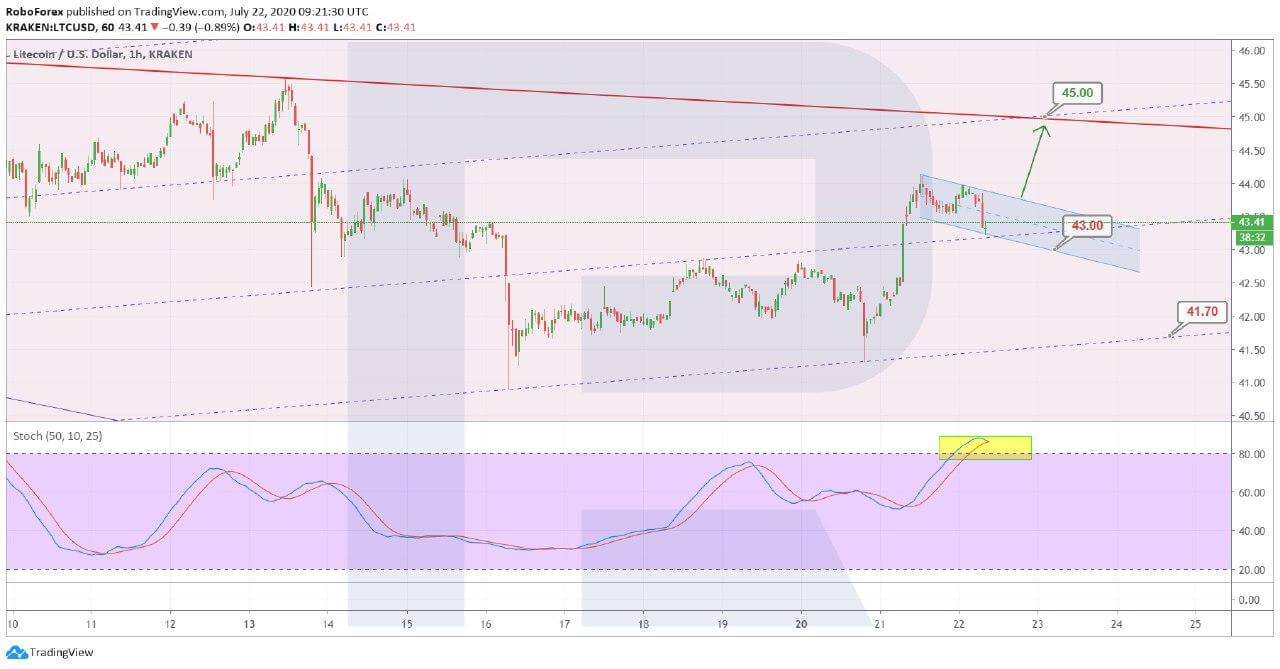
Photo: RoboForex / TradingView
Bitcoin SV
From the technical point of view, Bitcoin SV has broken the previous downtrend very confidently, and right now is forming a new uptrend. Еры short-term movement may be described as the completion of the descending correction with a test of the support line of the mid-term rising channel, and a breakout of the resistance line of the previous descending channel. The “Golden Cross” on MACD may indicate another rising impulse with the target at the resistance level and $218.50. The support area is $166.00.
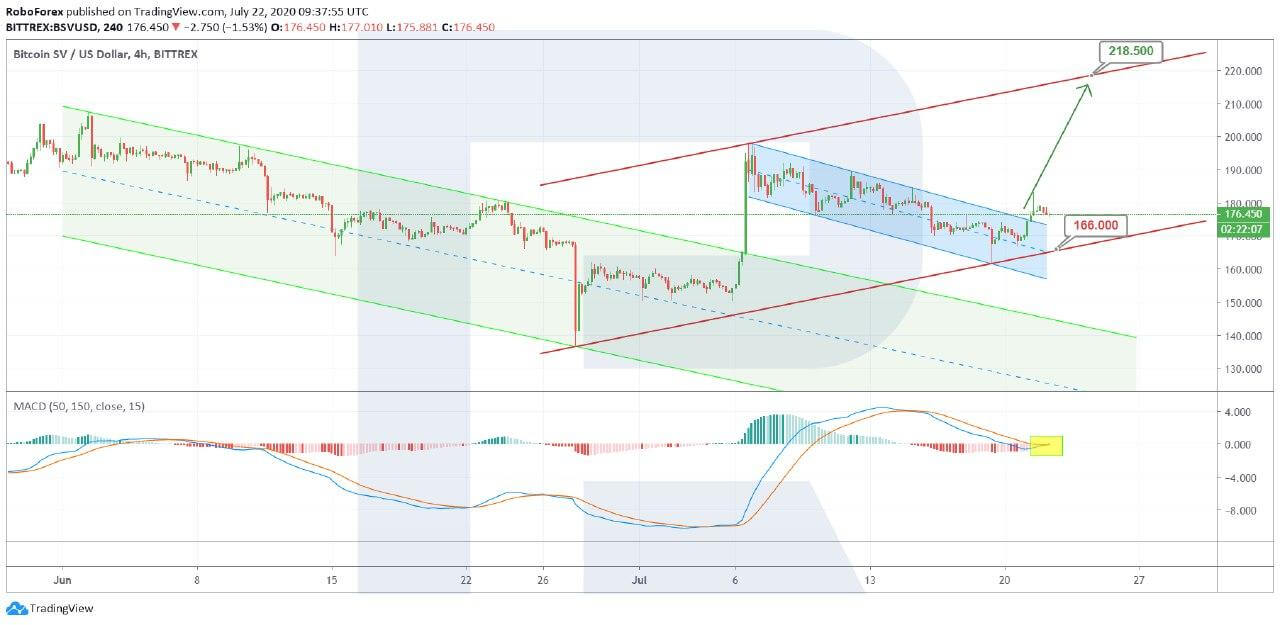
Photo: RoboForex / TradingView
The H1 chart shows a more detailed structure of the current uptrend after the change of the short-term tendency. Also, one should note that the ascending impulse has tested the upside border of the new channel, and right now is correcting to reach $174.00. If the price breaks this level, it may fall towards the key support area at $166.00. A signal in favor of this scenario is the “Black Cross” on Stochastic Oscillator in the “overbought area”. After completing the pullback, the instrument is expected to start another impulse to the upside towards $186.00.
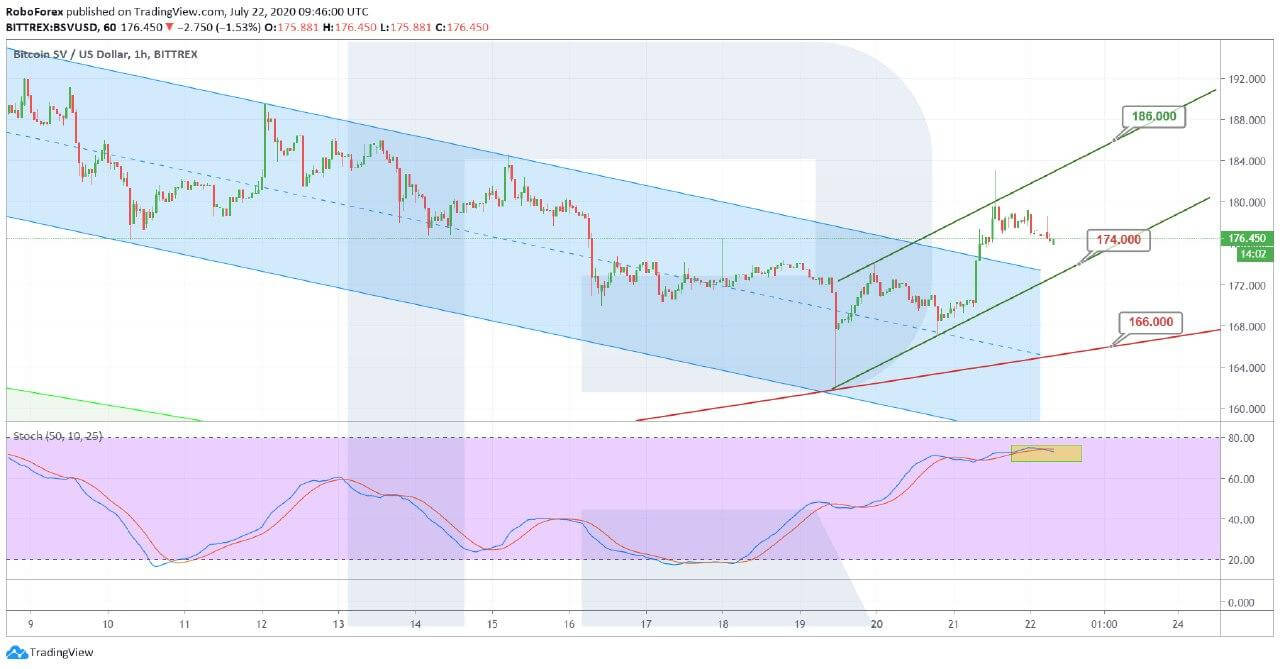
Photo: RoboForex / TradingView
EOS
As we can see in the H4 chart, EOS is trying to test and break the upside border of the triangle channel again. There is a “Golden Cross” above 0 on MACD, which means that there are chances of breaking the tested line and fixing above it. Also, one can see that the market is forming an ascending channel. The closest important upside target is $3.00, which is at the resistance line of the above-mentioned channel. However, one shouldn’t exclude the possibility of a pullback and a breakout of the support line at $2.52. if the price breaks this line, the asset may return to the support level of the triangle consolidation range and $2.15.
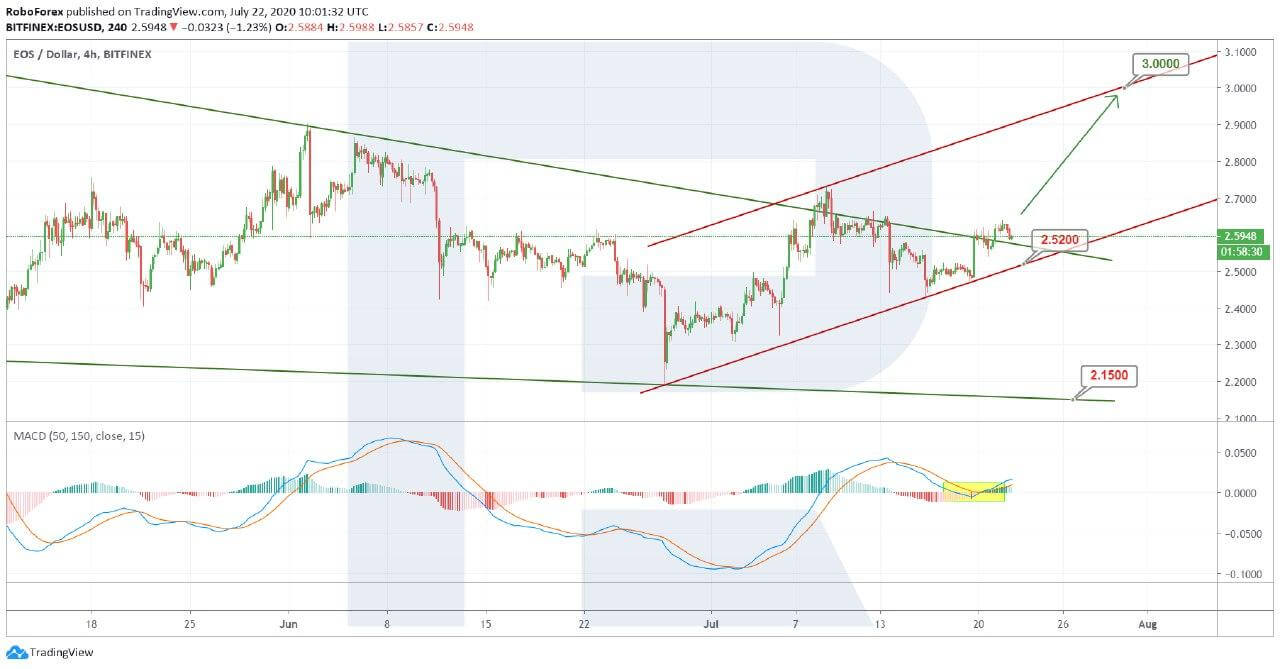
Photo: RoboForex / TradingView
The H1 chart shows a reversal of the short-term tendency after a breakout of the descending channel’s resistance line. At the same time, Stochastic Oscillator is forming the “Black Cross” and its lines are moving to the downside, thus indicating a local pullback with the target at $2.52 or even $2.45.
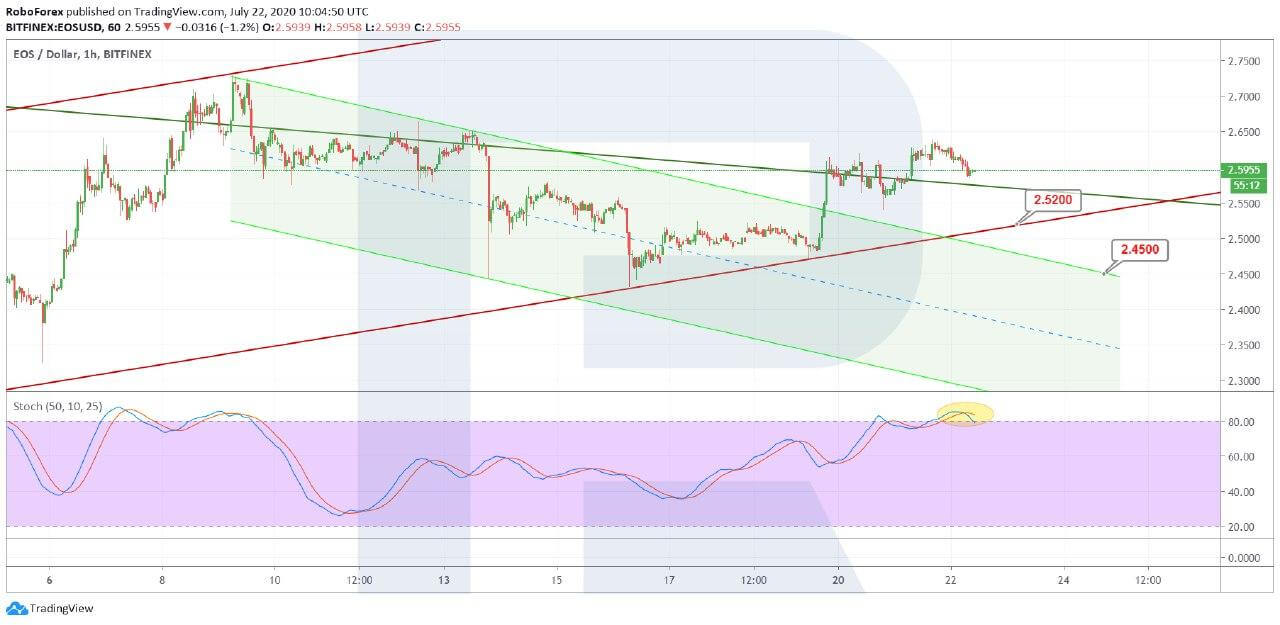
Photo: RoboForex / TradingView
Disclaimer: Coinspeaker is committed to providing unbiased and transparent reporting. This article aims to deliver accurate and timely information but should not be taken as financial or investment advice. Since market conditions can change rapidly, we encourage you to verify information on your own and consult with a professional before making any decisions based on this content.

Dmitriy Gurkovskiy is a senior analyst at RoboForex, an award-winning European online foreign exchange forex broker.


