
BNB jumped 3% to $637.7 as Nano Labs announces plans to accumulate up to $1 billion worth of the token as part of its long-term treasury strategy.
Binance Coin BNB $639.4 24h volatility: 0.3% Market cap: $87.15 B Vol. 24h: $983.05 M has seen a fresh wave of bullish momentum on Tuesday after dropping to as low as $600 during the weekend. At the time of writing, the 5th largest cryptocurrency is trading around $637.7, up by 3% in the past 24 hours.
This uptick follows Nasdaq-listed chip designer Nano Labs’ announcement to acquire BNB through a $500 million convertible note agreement. This move is part of its long-term crypto investment strategy.
Nano Labs stated that it would assess BNB’s security and utility before proceeding to purchase up to $1 billion worth of cryptocurrency via convertible notes and private placements.
In the long term, it aims to hold between 5% to 10% of BNB’s total circulating supply, which currently stands at 140.88 million tokens.
🚨 Announcement#NanoLabs has entered into a $500M convertible notes purchase agreement to launch our $BNB Strategic Reserve. $NA
🔗https://t.co/bj4nbzDUrq pic.twitter.com/i3ezU3MrcV
— Nano Labs (@NanoLabsLtd) June 24, 2025
Institutional Interest Boost Sentiment
Meanwhile, a Monday report by Bloomberg revealed that a group of hedge fund veterans, Patrick Horsman, Joshua Kruger, and Johnathan Pasch, is targeting $100 million in funding to invest directly in BNB.
The team, formerly with Coral Capital Holdings, plans to accumulate BNB through a newly formed company called Build & Build Corporation, which seeks eventual Nasdaq listing.
Investor confidence is also getting a boost from VanEck’s filing for a spot BNB ETF in the U.S. With analysts placing the approval odds for altcoin ETFs at around 90%, market sentiment has turned massively bullish.
If greenlit, such a product could funnel institutional capital into the ecosystem and potentially trigger a major BNB price breakout.
BNB Price Outlook
On the daily BNB price chart, the RSI is currently near 45, suggesting that BNB is recovering from mildly oversold conditions. However, the token is yet to enter strong bullish territory, with immediate resistance seen near $647, followed by $670.


BNB price chart with RSI and Bollinger Bands | Source: Trading View
Bollinger Bands are tightening slightly, with price attempting to reclaim the midline (20-day SMA) around $647.08. A successful close above this level could lead the token to the upper band near $673.
Meanwhile, the MACD remains in bearish territory with the MACD line below the signal line, but a potential crossover appears to be forming. If bulls take charge, BNB could push toward $690–$700.

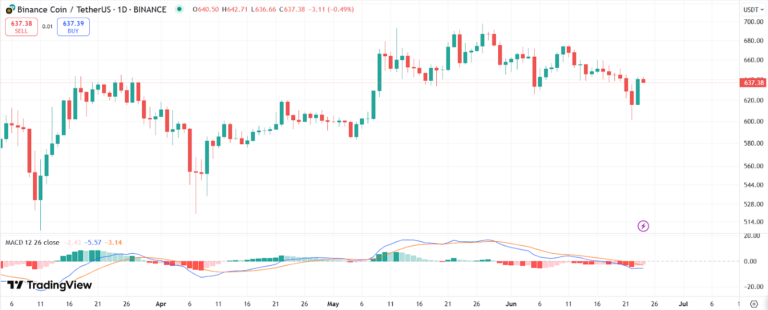
BNB price chart with MACD | Source: Trading View