
Ethereum (ETH) may be on the cusp of a historic breakout, according to prominent technical analyst Kevin, who sees a rare confluence of reversal signals not seen since the early stages of past altcoin seasons. While ETH currently trades at $2,485—down 1.73% for the day—the monthly chart reveals patterns that have preceded massive rallies in […]
Ethereum (ETH) may be on the cusp of a historic breakout, according to prominent technical analyst Kevin, who sees a rare confluence of reversal signals not seen since the early stages of past altcoin seasons.
While ETH currently trades at $2,485—down 1.73% for the day—the monthly chart reveals patterns that have preceded massive rallies in the past. Kevin highlights 3 major bullish indicators that could point to a coming price explosion.
First, in April, Ethereum printed what Kevin calls a “demand candle” on the monthly chart. Historically, this type of candlestick has only appeared twice since 2020. On both occasions, ETH entered powerful upward moves shortly after.
https://t.co/3P09q9QFlF #ETH #Altcoins #Crypto
— Kevin (@Kev_Capital_TA) June 2, 2025
Secondly, the monthly stochastic RSI is showing a pronounced “V”-shaped recovery out of the oversold territory. This pattern closely resembles what occurred in 2020, just before ETH launched into a parabolic move from $200 to over $4,000.
Finally, and perhaps the most striking pattern, is the multi-year MACD compression, forming what analysts interpret as a symmetrical triangle.
Ethereum Breakout Pattern Targets $4,800 – ETH Bulls Regain Control
Ethereum (ETH) has broken out of a steep descending wedge pattern, a classic bullish reversal signal, with price now climbing toward key resistance levels.
The first major resistance lies around $3,600 — a level that previously acted as support during the 2021-2022 cycle and was rejected multiple times since. A clean break above this area could open the path to $4,800, Ethereum’s all-time high, as mapped out by the dotted upside projection.

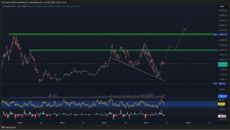
ETH Daily Chart | Source: TradingView
Momentum indicators support the bullish setup.
The RSI has cooled to 52.89 after a recent overbought spike, offering renewed upside potential without signaling exhaustion.
MACD histogram bars are recovering toward the zero line after bearish fading, with potential for a bullish crossover if buying resumes.
If Ethereum holds above the $2,300–$2,400 zone, a gradual grind toward the $4,800 region could unfold over the summer.
Longer term, a breakout above ATH could place $6,000 in sight — but failure to reclaim $3,600 convincingly may result in a retest of the $2,000 area.
Build on Ethereum, $BTCBULL Rides Bitcoin’s Wave
While ETH fundamentals attract potential investors, BTC Bull ($BTCBULL)—a community-driven meme coin on Ethereum—has garnered the crypto spotlight, rewarding holders as Bitcoin’s value climbs.
Every time Bitcoin rises by another $25,000, BTC Bull initiates one of two major actions: either a percentage of the $BTCBULL token supply is burned to create scarcity, or loyal holders receive BTC airdrops.
Interestingly, when Bitcoin hits the $250,000 milestone, a massive BTC airdrop will be distributed to the most dedicated hodlers.


BTC bull
Notably, in its ongoing presale, the meme coin project has already raised a whopping $6.8 million with 23 days, 23 hours until the next price increase.
To purchase the $BTCBULL token at the current price of $0.00255 per coin, hover to the official BTC Bull website.
Simply connect a supported wallet like Best Wallet and swap crypto or use a bank card to complete your $BTCBULL purchase.
next