
This Tuesday the price of Ethereum spiked from $143.50 to $165.85 price level.
In the past few days and weeks, the recent volatility observed in the combined crypto markets has mainly supported bulls.
This impetus allowed the price of Ethereum (ETH) to break past the key resistance levels that previously hindered its price action, which has now opened the door for significant further growth.
Ethereum, although, could not break past its main falling trend line, which suppressed its recent price movement, that is why some analysts continuously showed a bearish attitude towards cryptocurrency.
The ETH/USD crypto pair is at the moment trending at $165.35 (+ 9% daily). Ethereum reversed from an intraday high of $172.18; meanwhile, it is trading inside the short-term bearish trend amid a decrease in volatility.
The prevailing scenario is complex and risky. At that moment, a downward trend may be important, since it would return the price beneath the trend line, and the negative effect on the market bias may turn out to be remarkable.
Corresponding to the Ethereum DeFi Pulse statistical website, the value of digital assets worth $667.3 million, including just under three million Ether, is blocked in DeFi applications on the blockchain, compared to about $240 million in January of this year.
DeFi Pulse stated that about $706 million in applications were recorded on the DeFi market on ETH. At the time of composing, this value has increased to $788.1 million.
ETH/USD bears set down in the market to adjust the price after a strong bullish Tuesday. This Tuesday, the price of the crypto spiked from $143.50 to $165.85 price level, and in the early hours of Wednesday plunged to the price level at $159.13.
Despite these gloomy indicators, speculators are certain that the prominent altcoin has eventually discovered its momentum, at least concerning the USD, and is preparing for further growth.
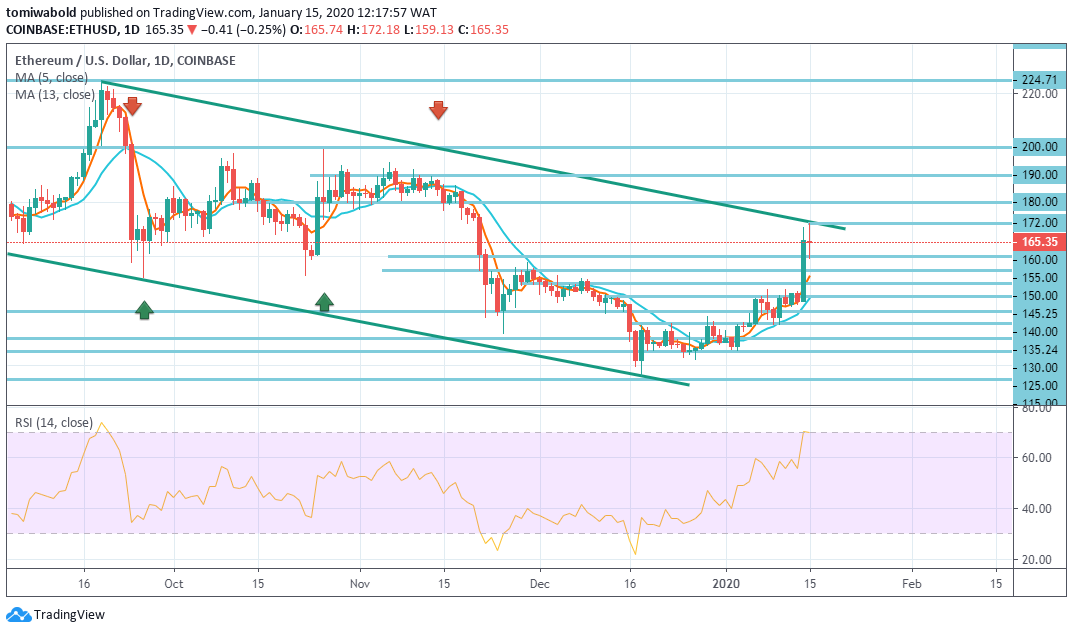

ETH/USD Fades at the Falling Trendline Resistance around $172.00 Level
Supply Levels: $200, $190, $180
Demand Levels: $160, $155, $150
ETH/USD is at the moment trading at the price level of $165.35 and is supported to break out of the downward trendline resistance area around the $172 level.
Ethereum has already broken out of the downward trend from relative highs. At present, it is trending into full bullish territory, which would be entered when past the horizontal resistance line now at $180 level.
Past the prevailing price level, the initial barrier level is situated on the level at $180, then the second at $190 and the third one at $200.
Beneath the prevailing price, the initial support level is situated on the level at $160, then the second at $155 and the third one at $150.
From a technical analysis point of view, we can conclude that although the bears control the situation for a moment, the overall market sentiment is bullish.
next