
Should there be a breakout at the upper trend line of the wedge by the Bulls; Ethereum price may rally towards $289 level provided the $258 level does not hold. If the Bears push the coin and it breaks out at $225, the price may find support at $191.
Key Highlights:
- Ethereum price is under bearish pressure;
- the Bulls may eventually prevail;
- consolidation is ongoing in the Ethereum market.
ETH/USD Medium-term Trend: Bearish
Supply Zones: $258, $289, $318
Demand Zones: $225, $191, $102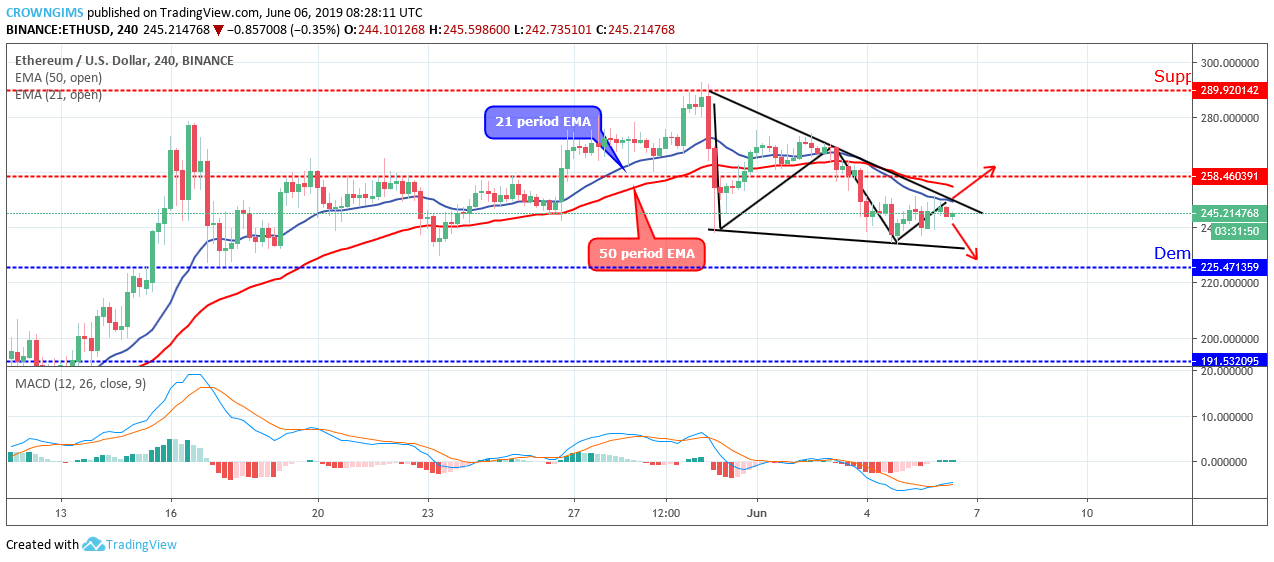

Bigger bearish candles formed and the bearish pressure was extended towards $225 level. The mark could not be reached before the Bulls interrupted and the price started consolidating. Ethereum price action has formed a falling wedge pattern on the 4-hour chart.
ETH price retains its trading below 21 periods EMA and 50 periods EMA, the latter is above the former as an indication of bearish movement. The Moving Average Convergence Divergence period 12 is faintly above the zero levels with the signal lines flat without showing any specific direction; this indicates that consolidation is ongoing in the 4-hour chart.
Should there be a breakout at the upper trend line of the wedge by the Bulls; the price may rally towards $289 level provided the $258 level does not hold. In case the Bears push the coin and it breaks out at $225, the price may find support at $191.
ETH/USD Short-term Trend: Bearish
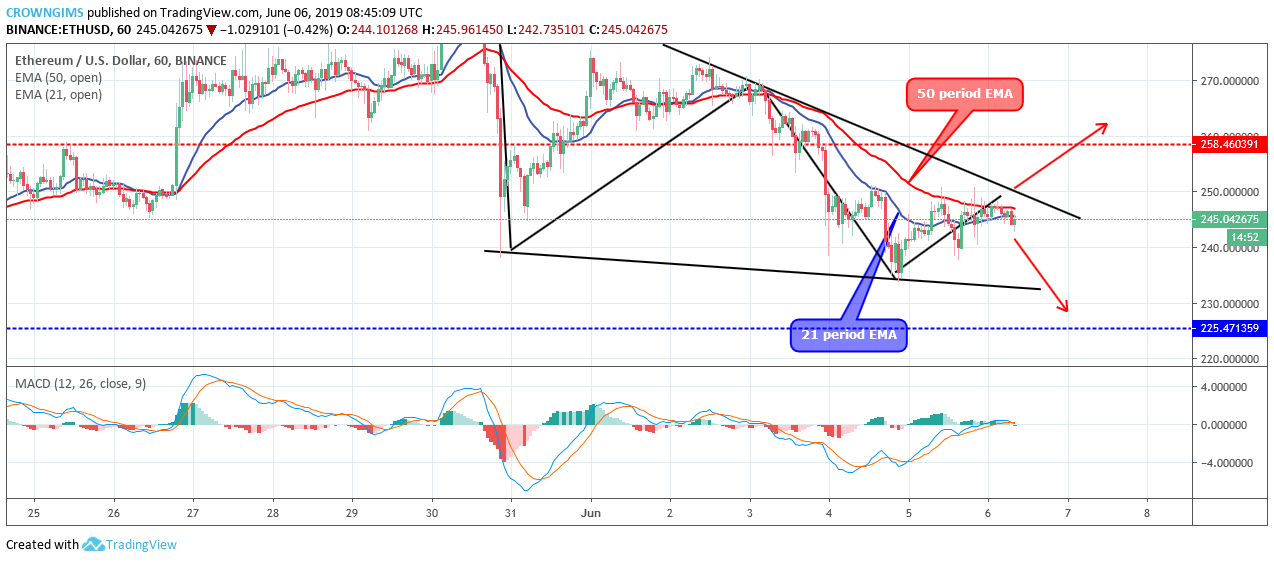
The crypto is trading in between the 21 periods EMA and 50 periods EMA as a sign of consolidation. The Moving Average Convergence Divergence period 12 with its histogram is flat horizontally at the level and the signal lines are equally flat at the zero levels; which indicates that consolidation may continue for short period of time.
next