
Ethereum displays concerning double top formation at $4,000 resistance with current price locked in symmetrical triangle near $2,424. Long liquidations exceed shorts as market awaits decisive breakout.
Ethereum ETH $2 069 24h volatility: 4.4% Market cap: $249.74 B Vol. 24h: $17.32 B is flashing a long-term warning as its monthly chart reveals a double top formation near $4,000, a key resistance area rejected twice since 2021.

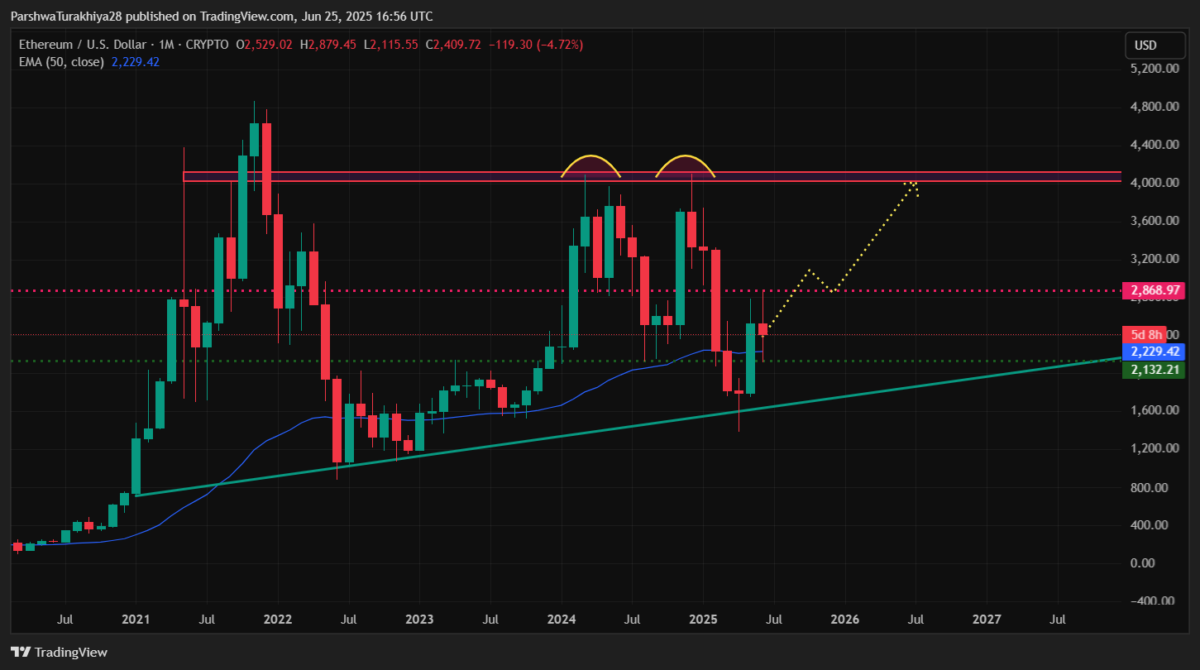
ETH price dynamics | Source: TradingView
The asset is still trading above the multi-year trendline that began from the 2020 lows. Dynamic support is seen around the 50-month EMA at $2,229, where the most recent bounce occurred. Ethereum price is now trading near $2,424, but traders are watching the neckline at $2,130–$2,200 for any signs of breakdown.
Symmetrical Triangle Keeps ETH Locked Below Key Resistance
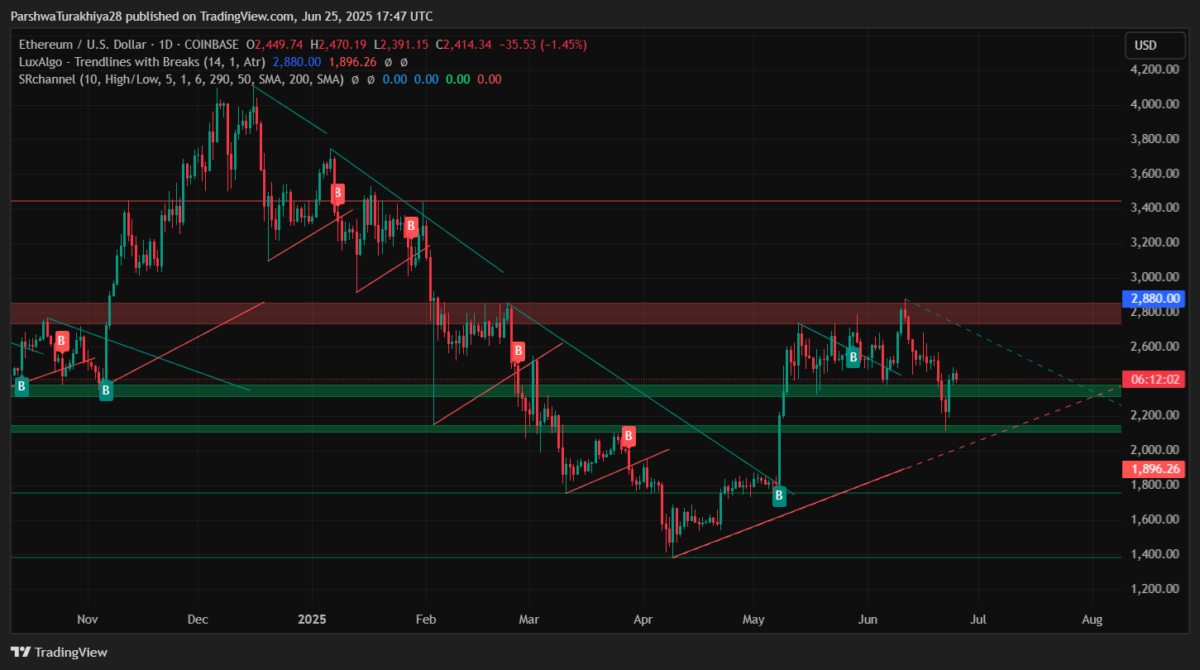
ETH price forecast | Source: TradingView
On the daily chart, ETH remains stuck inside a symmetrical triangle. Price recently rebounded from $2,220 but is capped by descending resistance at $2,520. RSI is near 46 and MACD remains negative, showing no momentum shift yet. Bollinger Bands are compressing, hinting at low volatility before a potential breakout.
A decisive move above $2,525 could flip the trend bullish. Until then, Ethereum price remains in a broader range between $2,200 and $2,870. Volume has been muted throughout, pointing to accumulation rather than distribution.
Despite near-term volatility, some market participants remain highly optimistic. A recent projection shared by Crypto GEMs suggests Ethereum could reach $50,000 within five years, based on long-term channel trend analysis.
$ETH #Ethereum could hit $50,000 in the next 5 years
— Crypto GEMs 📈🚀 (@cryptogems555) June 21, 2025
Long Liquidations Outpace Shorts
According to liquidation data, Ethereum saw $28.25 million in long liquidations over the past day, more than double short-side liquidations at $11.91 million.

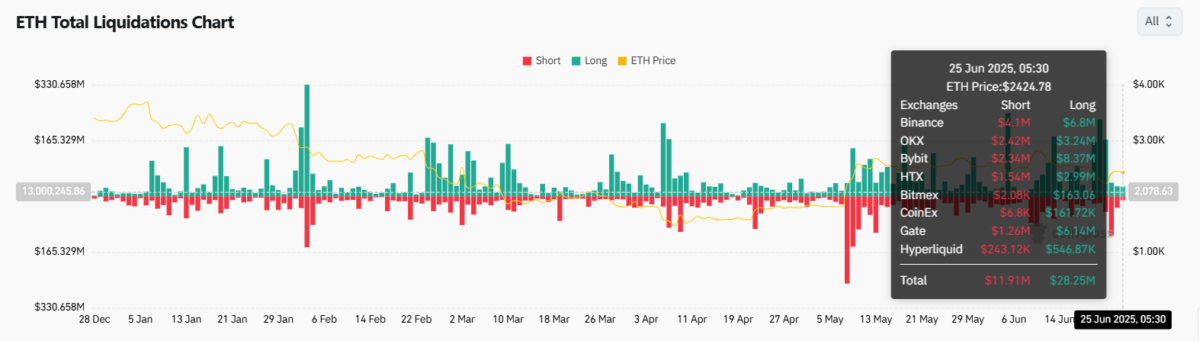
ETH liquidation chart | Source: Coinglass
Bybit led long-side liquidations at $8.37 million, while Binance topped the short side with $4.1 million.
These figures suggest that long-side leverage had overheated around the $2,500 mark, triggering liquidations as price failed to extend upward.
Spot Outflows Add to Short-Term Bearish Tone
Netflows show $44.13 million in ETH outflows from exchanges, typically a bullish sign. But paired with the liquidation pressure and stagnant price action, this likely reflects risk-off repositioning rather than accumulation.

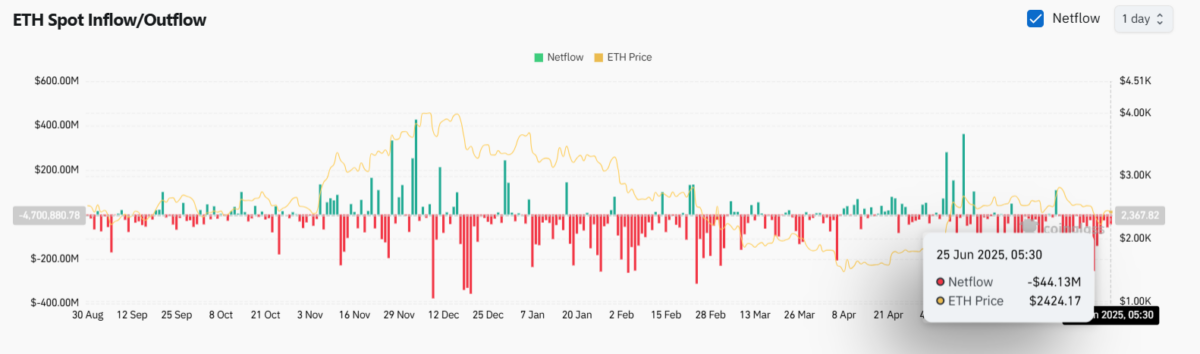
ETH net inflows/outflows | Source: Coinglass
Until Ethereum reclaims $2,870 or holds firmly above $2,300, the bias remains neutral to bearish in the short term. The monthly chart remains a critical inflection point, with bulls needing to defend $2,200 to maintain structure.
Ethereum recently rebounded from $2,131 following a major whale accumulation exceeding $8.9 million, which helped lift price back toward the $2,400 level.
Best Wallet Gains Investor Attention As Ethereum Consolidates
While Ethereum remains range-bound, traders seeking diversification are turning to Best Wallet, a self-custodial app offering multichain support, real yield, and AI-based asset tracking.


With over 100,000 downloads and support for Ethereum, Solana, and BNB Chain, Best Wallet is emerging as a go-to platform for secure Web3 interaction. Learn more and download now at Best Wallet.
next