
Taking long trades is not advisable at the moment because the long-term trend is bearish, and the bearish pressure may continue for some time.
Key Highlights:
- Further downwards movement confirmed in the Monero 4-Hour chart;
- there is a probability for price breaking out of the resistance level of $105;
- taking short trades is advisable.
XMR/USD Long-term Trend: Bearish
Resistance levels: $105, $120, $130,
Support levels: $77, $67, $56
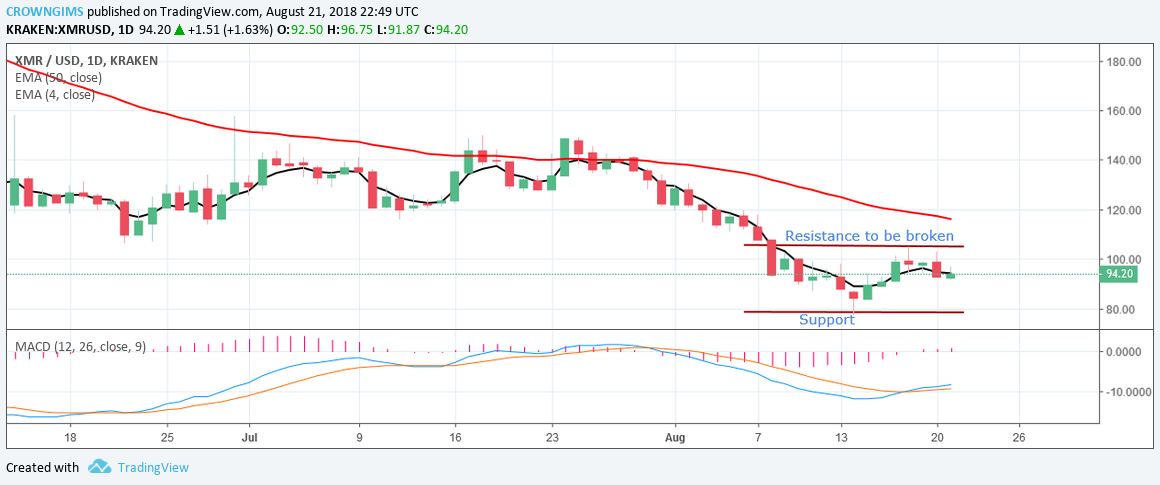

Now, it forms another bearish candle as the price moves close to the strong support level at $77. Should the strong support level get broken, the pair will drop further and get exposed to another strong support level at $67. The MACD, with its histogram below the zero level, indicates that the price may slide further downwards.
XMR/USD Price Medium-term Trend: Bearish
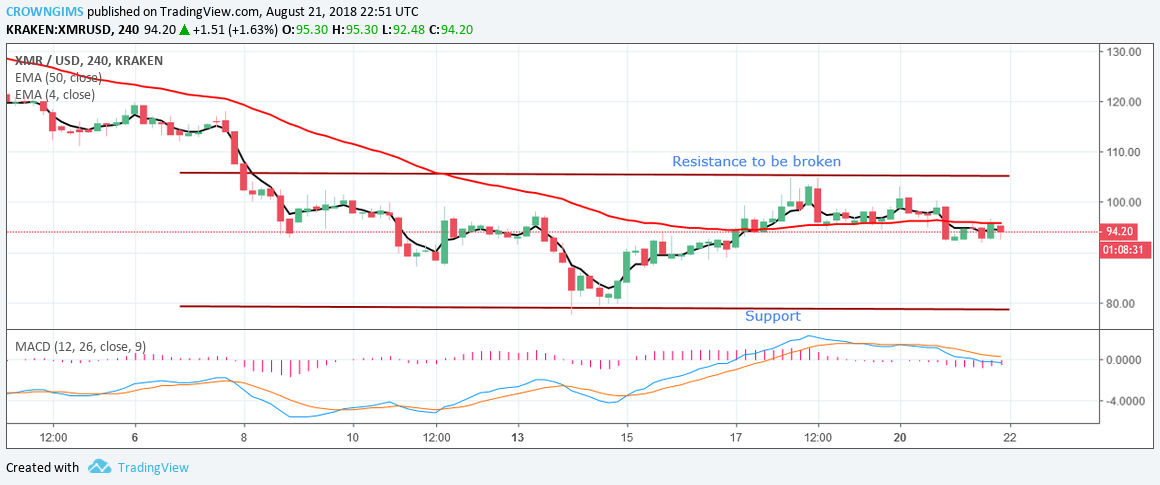
XMR/USD has been very bearish, making higher lows and lower lows in the channel within the levels of $105 and $77. Taking long trades is not advisable at the moment as the MACD in the 4-hour chart also supports short trades. XMR may break out to the upper trend lines and expose the price to another resistance level of $120.
next