
In case the distribution level of $111 is broken up, the pair will resume its uptrend movement and upper distribution territory of $119 will be exposed.
Key Highlights:
- The pair may resume its uptrend movement;
- the price may break out of the distribution territory;
- there is a probability of the bulls sustaining the trend.
XMR/USD Long-term Trend: Bearish
Distribution Territories: $111, $119, $126,
Accumulation Territories: $97, $86, $76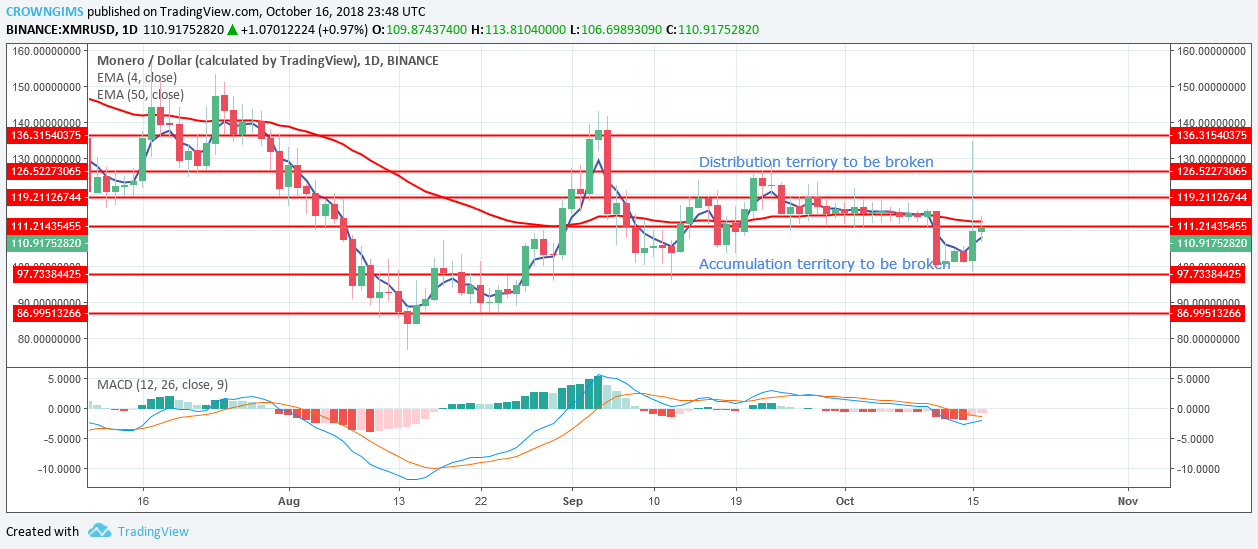

Uptrend movement was terminated at the distribution territory of $136. The bears came into the market immediately and push XMR down to accumulation territory 0f $111.
The price is at the accumulation territory of $111 with the formation of bullish candles. The 4-day EMA is below the 50-day EMA with the coin in between on the daily chart. The MACD with its histogram is below zero level with the signal lines points to the north indicates buy signaling.
In case the distribution level of $111 is broken up, the pair will resume its uptrend movement and upper distribution territory of $119 will be exposed.
XMR/USD Price Medium-term Trend: Bullish
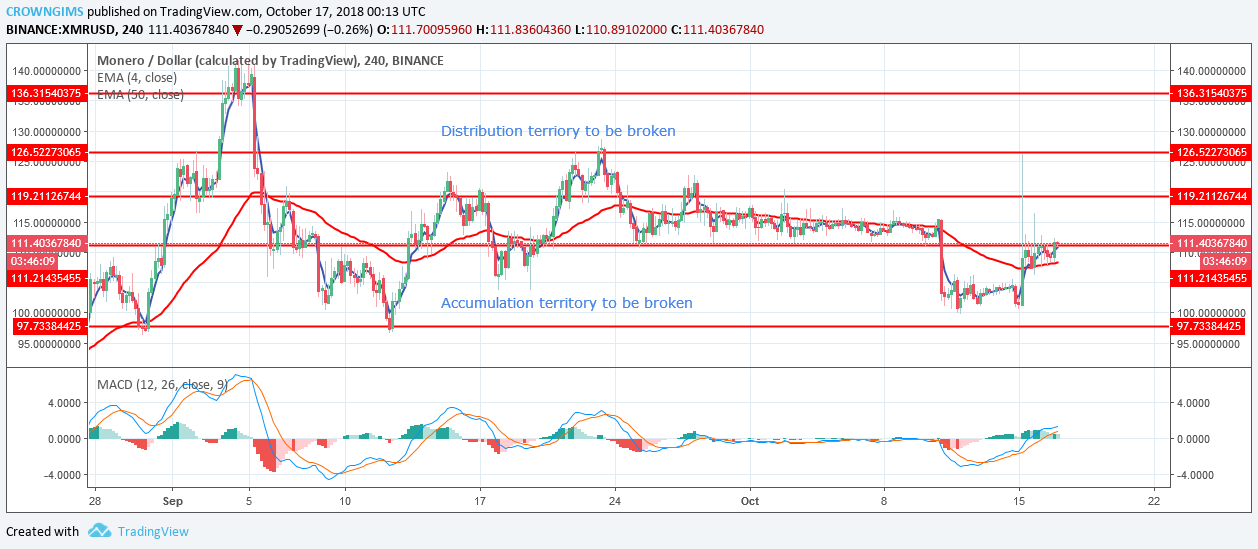
The 10-day EMA has crossed 50-day EMA up side. XMR is above 4-day EMA while 50-day EMA is below the 10-day EMA which indicates that there is a probability for the continuation of upward movement this week. MACD with its histogram and its signal lines are above the zero level with the signal lines point to the north indicate buy signal.
next