
The price continues its ranging within the territories of $150 and $102. Traders can look out to initiate a long trade at the lower level of price in case of the price fall to the lower level of the price range.
Key Highlights:
- There is a probability of further ranging movement within the territories;
- there may be increased in price this week;
- traders should take a long position at the lower level of the price range.
XMR/USD Long-term Trend: Ranging
Distribution Territories: $150, $178, $206
Accumulation Territories: $102, $77, $45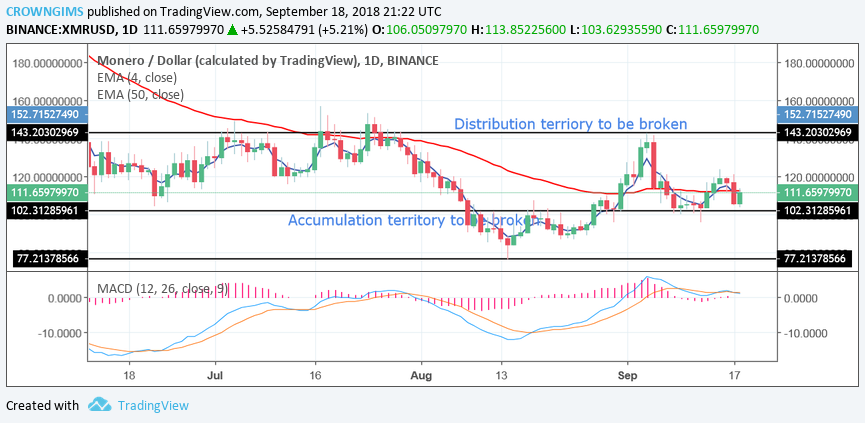

The price continues its ranging within the territories of $150 and $102. The 4-day EMA interlocked the 50-day EMA on the daily chart with the price consolidating below both 4-day EMA and 50 – day EMA.
Currently, the price has tested the accumulation level of $102, a bullish retracement is possible. Since the upper level of the price was not broken, that should have been an opportunity to initiate a short trade. Therefore, traders can look out to initiate a long trade at a lower level of price in case of the price fall to the lower level of the price range.
Should the strong accumulation level of $102 get broken, the pair will experience further downward movement and get exposed to another accumulation level at $77.
The MACD with its histogram at the zero level and the signal lines interlocked at zero level indicates that the price is consolidating at the accumulation territories of $102. Traders should watch out for the breakout and take a position.
XMR/USD Price Medium-term Trend: Bearish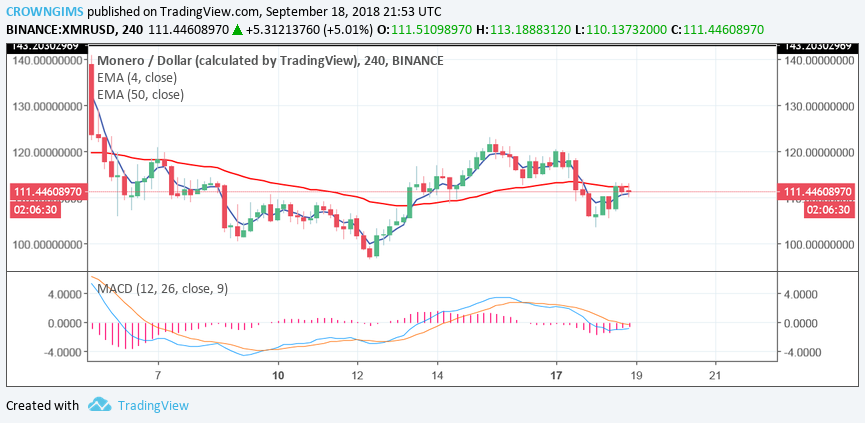
On the 4-Hour chart, the coin is in a downward trend. The price fell after the formation of a bearish engulfing bar at the distribution territories of $150 last two weeks. More strong bearish candles were formed and the price has been trending downward. The price is moving towards the north with 10-day EMA below the price and 50-day EMA, which indicates that there is a probability for the price to resume bullish movement this week. Should the coin breaks the lower distribution level of $77 further downtrend movement could be experienced. However, MACD is below zero with its signal lines pointing upward suggesting that the bulls may take control of the market this week.
next