
The coin broke the upper trend line of the last week ascending triangle which led to uptrend movement towards the distribution territory of $151.
Key Highlights:
- The price may retrace temporarily towards accumulation territory of $130;
- there is a probability of a further uptrend this week;
- taking long position this week may deliver green pips.
XMR/USD Long-term Trend: Bullish
Distribution Territories: $151, $184, $214
Accumulation Territories: $130, $120, $110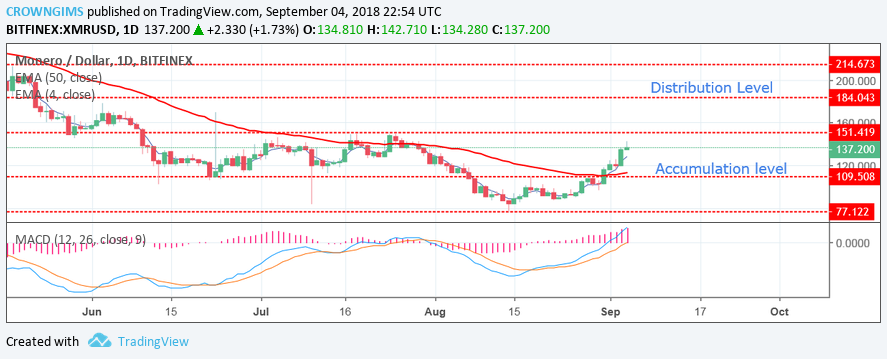

The price is exposed to a distribution level of $151.4 and a bearish retracement is possible which may be temporary. Should the distribution level of $151 get broken, the pair will get exposure to another strong distribution level at $184. The MACD, with its histogram above the zero level, and the signal lines pointing upwards, indicates that the price may go upwards further.
XMR/USD Price Medium-term Trend: Bullish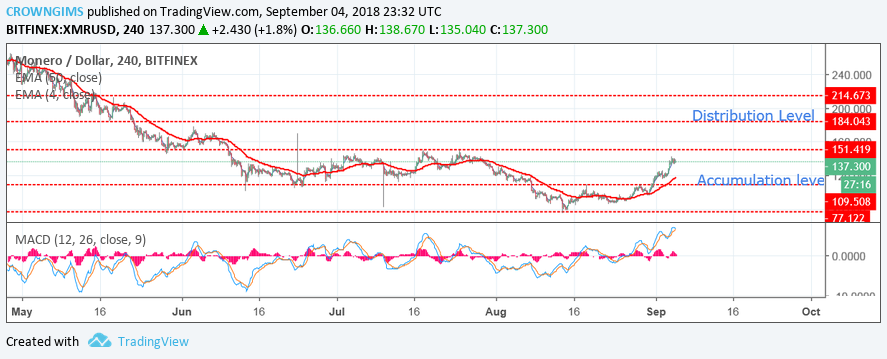
The “Ascending Triangle” pattern formed last week on the 4-Hour chart which indicates that there was a probability for the price to breakout at upper distribution territories. The coin broke the upper trend line of the triangle which led to uptrend movement towards the distribution territory of $151. The 4-day EMA is above the 50-day EMA and the price is above 4-day EMA, suggesting a further increase in price. Taking long position this week may deliver some green pips.
next